
Contents
Market Commentary
Portfolio Commentary
Notes from the Road
Business Update
Total Returns | As of June 30, 2025
Market Commentary
Key Takeaways
- Strong Quarter: Q2 2025 was one of the top five best quarters of absolute performance in 30 years for international small-cap growth stocks.
- Valuation Gap: Foreign Smid-cap stocks are trading at an 18% discount to U.S. large caps, 30% below their long-term average.
- Quality Discrepancy: High-quality foreign funds have underperformed low-quality peers by nearly 60% over five years, despite superior fundamentals.
- Capital Outflows: Outflows have hit high-quality foreign growth funds hardest, exacerbating the technical dislocation.
- Recovery Potential: Should fundamentals (E.g., high ROA, strong balance sheets) regain traction as a main driver of investment, we see substantial room for high-quality foreign Smid and Emerging Market Smid stocks to rebound.
The High-Quality Squeeze
The second quarter of 2025 brought strong equity market returns, despite heightened geopolitical uncertainty. Notably, foreign small cap growth stocks led the rally.
Exhibit 1
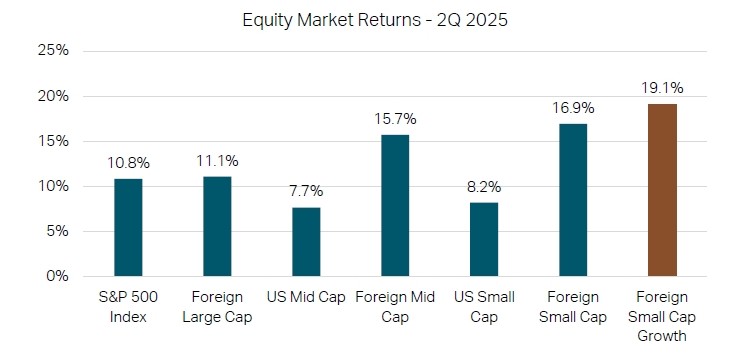
Source: Factset, MSCI Indices, June 30, 2025. Distinct color on Foreign Small Cap Growth column is to highlight the different asset classes over the period.
Over the past 30 years, there have been just four quarters in which foreign small-cap growth stocks returned more than they did this most recent quarter. This quarter also marked the first period in nearly five years when foreign growth stocks meaningfully outpaced their value counterparts. See Exhibit 2 below.
Exhibit 2
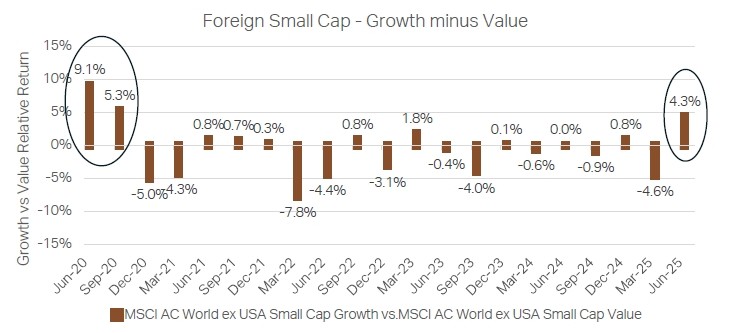
Source: Factset, MSCI Indices, June 30, 2025. Ovals are used to highlight the time gap between periods of significant outperformance by growth investments.
Despite these gains, foreign small-cap growth stocks continue to trade at very attractive relative valuations compared to U.S. large cap equities. Specifically, they are priced at nearly an 18% discount to U.S. large caps – approximately 30% below their 20-year average valuation differential.
Exhibit 3
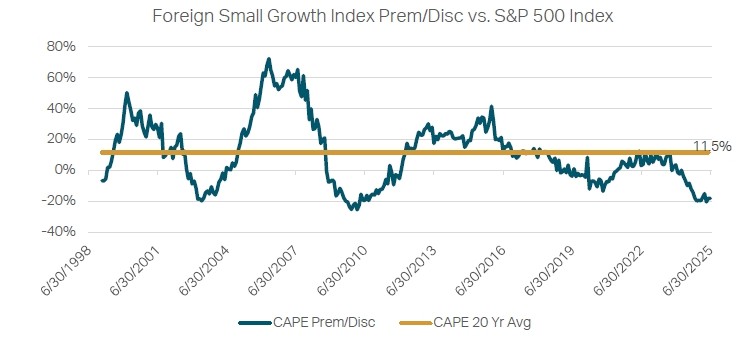
Source: Factset, MSCI, June 30, 2025
From a quality perspective, the quarter delivered mixed but relatively muted results. Higher-quality U.S. small-mid cap market funds, those targeting companies with strong returns on equity and low leverage, modestly lagged their lower-quality equivalents. Within foreign small-mid cap markets, higher-quality funds edged out lower-quality peers. Regardless, high-quality within foreign small-mid cap funds still have a lot of ground to make up in order to reconcile with fundamentals. The lowest quality quintile of funds has outperformed by nearly 60% over the past 5 years, while there has been very little disparity in performance across the quality spectrum within US small-mid cap markets.
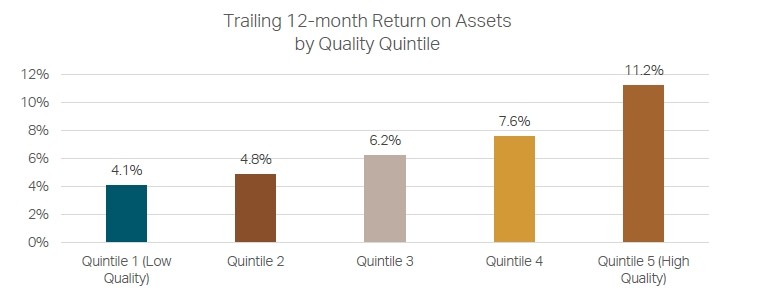
Exhibit 4
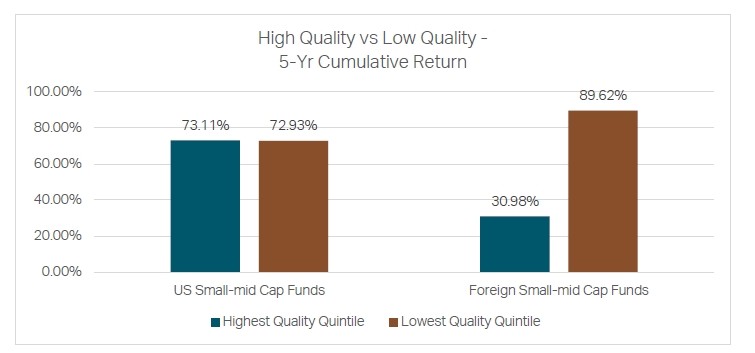
Source: Morningstar Direct Categories, June 30, 2025. The Morningstar category reflects an average of its constituent funds.
The significant relative outperformance by lower quality foreign small-mid cap funds has been very surprising given the weak fundamentals, where the fund average trailing 12-month return on assets (ROA) was 4.1%, 7.1% lower than the average ROA of the highest-quality cohort.
Exhibit 5
Source: Morningstar Direct Categories, June 30, 2025. The Morningstar category reflects an average of its constituent funds.
While there have been significant flows out of foreign small-mid cap strategies broadly over the past four years, the highest quality quintile of funds has experienced the highest volume of redemptions.
Exhibit 6
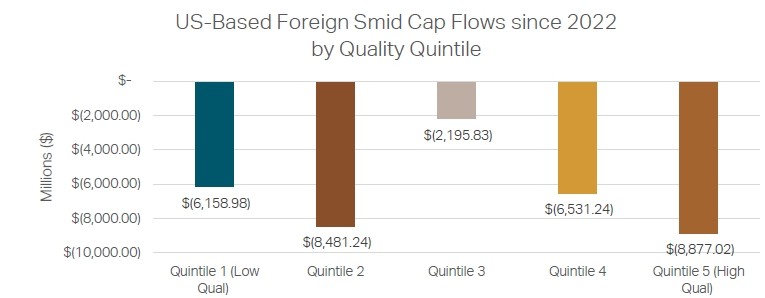
Source: Morningstar Direct Categories, June 30, 2025. The Morningstar category reflects an average of its constituent funds.
As a percentage of assets under management, the outflows from higher quality funds have been even more pronounced.
Exhibit 7
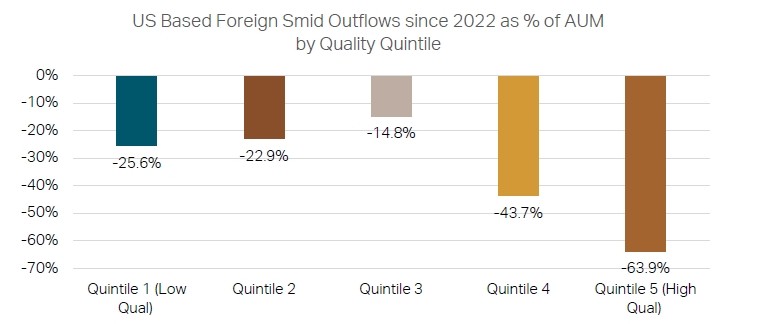
Source: Morningstar Direct Categories, June 30, 2025. The Morningstar category reflects an average of its constituent funds.
As a result, the highest quality quintile of funds now has the smallest share of assets under management within the foreign small-mid category for the first time on record.
Exhibit 8
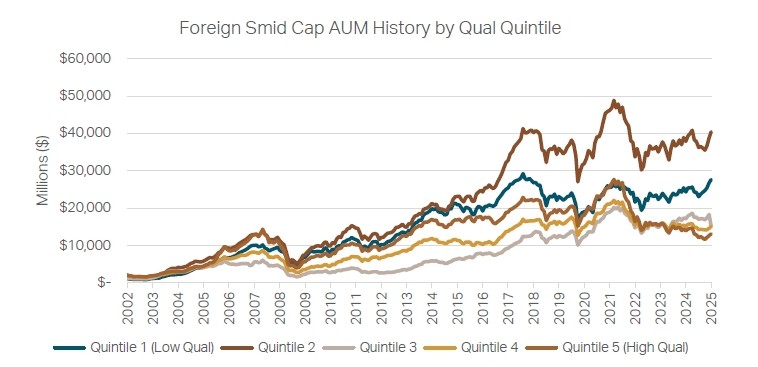
Source: Morningstar Direct Categories, June 30, 2025. The Morningstar category reflects an average of its constituent funds.
This begs one to question how much investor outflows within foreign small-mid cap funds have contributed to the significant disparity in performance results across the quality spectrum. Regardless, it is clear that higher quality stocks within the space have been subject to a significant technical dislocation over the past five years.
Conclusion
Although foreign small-cap growth stocks delivered strong returns last quarter, we believe significant upside remains. This view is supported by compelling relative valuations compared to other equity market segments and historically low prices of higher-quality stocks within the foreign small-cap space. Put differently — we believe there is still plenty of juice left in the high-quality foreign small cap market squeeze.
Portfolio Commentary
All of the Grandeur Peak funds exhibited strong absolute performance in Q2, and nearly all the funds also outperformed their respective benchmark. Despite the tariff rollercoaster ride we have all been on, the quarter’s performance seemed to be driven by a combination of company-level fundamentals, sector allocation, and growth stocks outperforming.
Industrials performed well in Q2, beating benchmarks in most of our funds. Contributors came from many areas across Japan, Europe, and the US, including some cyclical names and other higher-quality ones. We had success with holdings related to industrial services, data centers, in addition to more idiosyncratic companies.
It is worth pointing out that many industrial companies are in wait-and-see mode as it relates to capital expenditures due to uncertainty surrounding interest rates and tariffs. Therefore, management teams are more hesitant than usual to provide guidance about the future. We know that Industrials could be directly impacted by an economic downturn, so we have been treading lightly when it comes to cyclical exposure and leaning into higher-quality positioning.
There are a number of business models that we are attracted to within Industrials. One of those is serial acquirers (we also call them industrial compounders). Within this subset of industrials, we are looking for a systematic and proven acquisition strategy, significant headroom for accretive acquisitions, plus organic (non-acquisition) growth of at least 5%.
More generally, we like commercial and professional services companies that provide demonstrable value-add and capital goods companies that effectively allocate capital and operate in markets with long-term tailwinds.
Our performance within Financials was positive but failed to keep up with respective benchmarks in most cases. Areas of strong performance that we missed were Banking in Eastern Europe and the Middle East, Fintech, and Insurance. Our perspective is that most of this benchmark outperformance was not in high quality companies capturing earnings growth.
Our Financials exposure is focused on a few key areas. We invest in financial infrastructure providers that are mission critical, produce recurring earnings, and have proven to be industry disruptors. Additionally, we’re invested in several great companies exposed to the alternative asset management industry. We are specifically attracted to managers which have demonstrated strong fundraising ability and are expert in diversified, uncorrelated asset classes.
Technology was the strongest performing sector from an absolute and relative perspective in most of the funds. Within the sector, our Semiconductor holdings produced sizeable gains. This is an area where we have struggled in recent years. We have been patient, leaning in when valuations have gotten too cheap. We are grateful to see the early stages of reversion in these names. One of the largest contributing companies in the 2nd quarter was a Belgian semiconductor developer focused on the auto sector. This is a company we highlighted earlier this year, as we had identified that the stock was significantly undervalued relative to its financial position. Within the semiconductor space, our preference is for businesses with pricing power and a diverse customer base, which is what we are getting with this Belgian company.
Software holdings also provided a positive contribution to returns. We believe that Software investments require a high bar given how quickly ideas can be commodified in an artificial intelligence world. In our analysis, we are looking for software companies with distribution advantages, network effects, mission critical products, and strong cash generation being reinvested back into the business.
Our Consumer holdings had a great quarter with strong returns and outperformance in every fund. The realized earnings growth has been solid, and our expectations are for that momentum to accelerate over the next year.
Our current areas of focus within Consumer can primarily be put into three categories: discount products, brands and luxury, and emerging consumption. Within discount products, we look for retailers providing good value that is insensitive to market trends. We also gravitate towards companies that pass cost savings through to customers to create pricing moats and strengthen loyalty.
Within brands and luxury, we recognize that strong brands are able to support pricing power. We gravitate towards brands with higher-income customers who are less cycle sensitive. Additionally, we look for companies able to create and maintain high gross margins and returns on capital.
Emerging consumption is the third bucket of Consumer companies. These include companies with underpenetrated product categories operating in markets with room to grow and long-term demographic tailwinds. We connect global dots and recognize early-stage businesses in new markets with high probabilities of success.
Looking at geographic attribution, Japan provided the highest excess return in every fund that invests in the country (not including US Stalwarts or Emerging Markets Opportunities). Our team recognized a compelling opportunity to increase our Japan exposure in 2024. Research analysts traveled to the country early this year, gaining fresh insights and added conviction. We increased our Japanese weight and concentrated into our highest conviction names. The most recent earnings results were strong, and we have also benefited from appreciation in the Yen this year.
We have been encouraged to see company fundamentals return as a primary factor in this quarter’s performance and yet still feel there are high-quality names in our portfolios which we believe remain underappreciated.
Notes from the Road
Company Touch Tracker
This quarter our team engaged with 455 companies across the world, putting our trailing 12-month company touches at 1,707.
In Q2, team members traveled domestically to Massachusetts, Minnesota, Kentucky, Utah, California, and Florida. Internationally, team members traveled to Japan, Sweden, India and the United Kingdom and interacted with companies in 32 other countries. We track these interactions and share them on our Company Touch Tracker1.
India Recap
Tyler Glauser, Joseph Nydegger, Matt Kaelberer, Nick Luong, and Rafael Seminaro, Research Analysts, traveled to India this quarter. Here are some of Tyler’s thoughts on their research trip:
Last month, I traveled to India for the third time in the last seven years. Accompanied by my colleagues Joe and Rafa, we spent two days in Mumbai and three in the Delhi area visiting a range of consumer-focused companies.
Having first visited India in 2018, then again in 2022, I can say without hesitation that each visit has revealed a striking “step-change” improvement—especially in infrastructure. The transformation is no longer incremental; it is exponential. Roads are better. Airports are more modern. Power outages—once a common frustration—have become rare. India today presents itself as a country in motion, one that is steadily shedding the inefficiencies of its past and embracing the momentum of growth.
India’s macro backdrop is encouraging. Real Gross Domestic Product (GDP2) growth remains healthy, while inflation—historically, a challenge for the Indian economy—has eased in recent quarters. Confidence in the real estate market has returned, bolstered by increasing investments and improved buyer sentiment. Developers we spoke with noted that units are moving again, and pricing power has quietly re-emerged in certain metro corridors.
Consumer confidence, while debated in some circles, appears largely intact. Several company executives acknowledged some pockets of softness—particularly in discretionary spending—but framed it as a normalization rather than a downturn. One CEO shared an intriguing perspective: he believes domestic consumption is stronger than it looks in the data, but the growth is being masked. His reasoning? High hotel prices within India are encouraging affluent Indians to vacation abroad. So, while local hotel occupancy may be down, overall discretionary travel spending could still be robust—it is just happening outside India’s borders.
This trip reinforced a core belief we have held for years that India has an enormous amount of headroom for growth. And that opportunity is especially pronounced in consumer sectors.
Consider the data:
- Sports and Athleisure Footwear: Still a nascent category compared to developed markets, with penetration levels well below global norms. Leading brands are seeing double-digit volume growth driven by young, aspirational consumers entering the workforce.
- Per Capita Biscuit Spending: A surprisingly low consumption rate for a country with such a strong snacking culture, as compared to Japan, the UK, and the US at 5x, 7x, and 10x India’s rate, respectively. One company noted that even small innovations in packaging (e.g., smaller, more affordable sachets) have been instrumental in driving rural sales.
- Out-of-Home Food Consumption: Perhaps the most dramatic illustration of India’s untapped potential. In the U.S., about 15 out of 21 weekly meal occasions occur outside the home. In Thailand, the number is 6. In India? Just 1 in 61—for the top 20% of the population. The implications for Quick Service Restaurant (QSR) chains, delivery platforms, and urban convenience food players are enormous.
- Consumer Durables and Household Penetration: India still trails significantly in product ownership across categories like air conditioners, washing machines, and microwaves. Yet these are the very categories where rising urban incomes and improved access to credit are starting to drive adoption.
Whichever metric you use, the story is the same: India is not just growing—it is catching up. And that catch-up has a long runway ahead.
Beyond the consumer story, this visit made us more optimistic about India’s role on the global stage. Geopolitically, India occupies a rare, sweet spot. The country is friendly with the West—deepening its ties with the U.S. and Europe—while also maintaining robust trade relations with Russia. Despite persistent tensions with Pakistan, and a complex relationship with China, India manages to preserve diplomatic channels and economic activity across most of Asia.
An especially intriguing dynamic we discussed during our meetings is India’s internal religious-demographic shift. Currently, about 40% of the population is Muslim, and this segment is growing more rapidly—particularly in rural areas, where polygamy remains legally permissible among Muslim men. While this presents socio-political complexities, it also adds to India’s multifaceted identity. As global supply chains diversify away from China (“China + 1”), India stands out not just for its cost advantages and talent pool, but also for its ability to engage diplomatically with a wide range of partners. That could be a decisive edge in the turbulent decades ahead.
We came away from our meetings with a sense that we were underweight Indian consumer companies across our strategies. The combination of improving infrastructure, favorable demographics, rising per capita income, and political stability makes the consumer space particularly compelling. While we will still need to balance regional exposure and valuations, we believe there are a number of names that could warrant more weight in our portfolios. India has felt overvalued for the last few years but has recently returned to a more fairly priced market in pockets.
Several companies we met with stood out not just for their growth trajectories, but for the quality of their management teams and the clarity of their execution. These are not speculative “future bets;” they are well-run businesses benefiting from secular tailwinds. Many of them are also focused on premiumization and market segmentation, two themes we believe will be critical as India’s middle class continues to expand.
As is true with all our research trips, we examine our portfolios to determine where we might find room to benefit, with our discoveries in mind. As for India, the thesis is clear: India is not just a structural story—it is an investable one today.
Returning to India is always enlightening. There is a certain vibrancy to the country—a mix of chaos and opportunity, legacy, and modernity—that makes it unlike any other emerging market. What struck me most on this trip was how much of the upside is still ahead. For all the progress India has made, it remains a country in transition. But that transition is moving faster now. Infrastructure is catching up. Consumers are moving up. Policymaking is getting more pragmatic. And capital is flowing in. We left feeling not only encouraged but energized. This is a story we want to be part of.
Business Update
Robert and Susie Gardiner have returned from Florida at the conclusion of their three-year service sabbatical. They were in the office on July 1st to reconnect with the team. Robert continues his current role as Chairman and is engaging in all phases of our research work. He has given himself the next couple of months to prepare for any pending portfolio manager assignments.
Erik Christiansen joined Grandeur as a full-time global research analyst this quarter. He began as an intern, Spring 2024 and recently graduated from Brigham Young University with his MBA. He also has a BS in Economics and previously worked at Ethos Investment Management. While in school, Erik was president of the student investment fund. He is currently a key member of the Technology sector team.
We congratulate Tyler Olson, who recently completed all requirements to become a CFA charterholder. Tyler works as a Quantitative Analyst and is a key member of our Quantitative Research team.
Our most recent Annual Report and Tailored Shareholder Reports can be found on our Literature3page along with all other regulatory filings.
As always, please feel free to reach out any time with any questions, requests, or comments. We appreciate the opportunity to work on your behalf.
Sincerely,
Todd Matheny, CAIA®
Jesse Pricer, CFA®
Amy Johnson, CFP®
The Grandeur Peak Client Team
Total Returns | As of June 30, 2025
| CUMULATIVE | ANNUALIZED | |||||||
| QTR | YTD | 1 YR | 3 YR | 5 YR | 10 YR | SINCE FUND INCEPTION | ||
| Global Contrarian, Institutional Class (GPGCX) | 12.70% | 10.95% | 23.08% | 16.54% | 17.29% | n/a | 14.33% | |
| MSCI ACWI Small Cap IndexI | 12.37% | 7.90% | 13.57% | 12.40% | 11.33% | n/a | 8.58% | |
| MSCI ACWI ex USA Small Cap IndexII | 16.93% | 17.68% | 18.34% | 13.46% | 10.74% | n/a | 8.48% | |
| Morningstar Category Average: Foreign Small/Mid ValueIII | 15.15% | 22.41% | 24.20% | 17.07% | 14.41% | n/a | n/a | |
| Global Explorer, Institutional Class (GPGEX) | 14.25% | 8.79% | 11.58% | 7.98% | n/a | n/a | -3.43% | |
| MSCI ACWI Small Cap Index | 12.37% | 7.90% | 13.57% | 12.40% | n/a | n/a | 3.85% | |
| Morningstar Category Average: Global Small/Mid StockIV | 12.07% | 7.91% | 11.37% | 8.73% | n/a | n/a | n/a | |
| Global Micro Cap, Institutional Class (GPMCX) | 13.32% | 12.20% | 16.49% | 10.76% | 9.11% | n/a | 9.24% | |
| MSCI World Micro Cap IndexV | 15.19% | 13.25% | 20.01% | 8.70% | 9.54% | n/a | 7.33% | |
| MSCI ACWI Small Cap Index | 12.37% | 7.90% | 13.57% | 12.40% | 11.33% | n/a | 8.30% | |
| Morningstar Category Average: Foreign Small/Mid GrowthVI | 18.47% | 18.78% | 18.86% | 11.93% | 6.57% | n/a | n/a | |
| Global Opportunities, Institutional Class (GPGIX) | 16.35% | 8.82% | 7.67% | 4.55% | 5.22% | 6.80% | 10.29% | |
| Global Opportunities, Investor Class (GPGOX) | 15.76% | 8.43% | 7.19% | 4.21% | 4.91% | 6.50% | 9.98% | |
| MSCI ACWI Small Cap Index | 12.37% | 7.90% | 13.57% | 12.40% | 11.33% | 7.44% | 9.33% | |
| Morningstar Category Average: Global Small/Mid Stock | 12.07% | 7.91% | 11.37% | 8.73% | 8.24% | 5.90% | n/a | |
| Global Reach, Institutional Class (GPRIX) | 13.68% | 8.79% | 12.19% | 7.88% | 6.26% | 7.14% | 8.81% | |
| Global Reach, Investor Class (GPROX) | 13.65% | 8.63% | 11.92% | 7.61% | 6.00% | 6.87% | 8.55% | |
| MSCI ACWI Small Cap Index | 12.37% | 7.90% | 13.57% | 12.40% | 11.33% | 7.44% | 8.12% | |
| Morningstar Category Average: Global Small/Mid Stock | 12.07% | 7.91% | 11.37% | 8.73% | 8.24% | 5.90% | n/a | |
| Global Stalwarts, Institutional Class (GGSYX) | 15.43% | 7.50% | 8.31% | 5.31% | 3.29% | n/a | 7.92% | |
| Global Stalwarts, Investor Class (GGSOX) | 15.35% | 7.37% | 8.05% | 5.03% | 3.03% | n/a | 7.65% | |
| MSCI ACWI Mid Cap IndexVII | 11.43% | 11.49% | 18.21% | 13.63% | 11.24% | n/a | 8.82% | |
| MSCI ACWI Small Cap Index | 12.37% | 7.90% | 13.57% | 12.40% | 11.33% | n/a | 8.61% | |
| Morningstar Category Average: Global Small/Mid Stock | 12.07% | 7.91% | 11.37% | 8.73% | 8.24% | n/a | n/a | |
| Intl Opportunities, Institutional Class (GPIIX) | 18.52% | 14.29% | 10.44% | 4.72% | 3.51% | 5.15% | 8.72% | |
| Intl Opportunities, Investor Class (GPIOX) | 18.37% | 14.10% | 10.19% | 4.50% | 3.28% | 4.93% | 8.47% | |
| MSCI ACWI ex USA Small Cap Index | 16.93% | 17.68% | 18.34% | 13.46% | 10.74% | 6.54% | 7.36% | |
| Morningstar Category Average:Foreign Small/Mid Growth | 18.47% | 18.78% | 18.86% | 11.93% | 6.57% | 6.01% | n/a | |
| Intl Stalwarts, Institutional Class (GISYX) | 20.40% | 14.98% | 10.43% | 6.23% | 4.10% | n/a | 8.24% | |
| Intl Stalwarts, Investor Class (GISOX) | 20.31% | 14.78% | 10.17% | 5.95% | 3.83% | n/a | 7.97% | |
| MSCI ACWI ex USA Mid Cap IndexVIII | 15.70% | 20.69% | 22.52% | 14.31% | 9.82% | n/a | 7.08% | |
| MSCI ACWI ex USA Small Cap Index | 16.93% | 17.68% | 18.34% | 13.46% | 10.74% | n/a | 7.70% | |
| Morningstar Category Average: Foreign Small/Mid Growth | 18.47% | 18.78% | 18.86% | 11.93% | 6.57% | n/a | n/a | |
| EM Opportunities, Institutional Class (GPEIX) | 13.25% | 9.69% | 3.29% | 4.02% | 4.02% | 4.01% | 4.62% | |
| EM Opportunities, Investor Class (GPEOX) | 13.22% | 9.62% | 3.08% | 3.77% | 3.79% | 3.77% | 4.39% | |
| MSCI Emerging Markets SMID Cap IndexIX | 16.82% | 15.27% | 13.74% | 12.85% | 11.63% | 5.34% | 5.18% | |
| Morningstar Category Average: Diversified Emerging MarketsX | 12.54% | 14.46% | 13.34% | 10.41% | 7.21% | 4.74% | n/a | |
| US Stalwarts, Institutional Class (GUSYX) | 11.03% | -1.13% | 7.22% | 7.46% | 6.17 | n/a | 14.56% | |
| MSCI USA Mid Cap IndexXI | 7.65% | 3.97% | 14.24% | 12.89% | 12.58 | n/a | 18.78% | |
| MSCI USA Small Cap IndexXII | 8.18% | -0.31% | 9.25% | 11.32% | 11.82 | n/a | 18.31% | |
| Morningstar Category Average: Mid-Cap GrowthXIII | 13.88% | 4.42% | 15.12% | 14.90% | 9.32 | n/a | n/a | |
An investor should consider investment objectives, risks, charges, and expenses carefully before investing. To obtain a Grandeur Peak Funds prospectus, containing this and other information, visit www.grandeurpeakglobal.com or call 1-855-377-PEAK (7325). Please read it carefully before investing.
The performance data quoted represents past performance. Current performance may be lower or higher than the data quoted above. Past performance is no guarantee of future results. The investment return and principal value of an investment will fluctuate so that the investor’s shares, when redeemed, may be worth more or less than their original cost. For performance information current to the most recent month-end, please call 1-855-377-PEAK (7325).
The Advisor may absorb certain Fund expenses, without which the total return would have been lower. Net Expense Ratio reflects the expense waiver, if any, contractually agreed to through September 1, 2025. A 2% redemption fee will be deducted on fund shares held 60 days or less. Performance data does not reflect this redemption fee or taxes.
| TOTAL EXPENSE RATIOS & INCEPTION DATES | |||||||||
| Inception Date | INVESTOR | INSTITUTIONAL | |||||||
| Fund | Gross | Net | Gross | Net | |||||
| Global Contrarian (GPGCX) | 09/17/2019 | 1.35% | 1.35% | ||||||
| Global Explorer (GPGEX) | 12/16/2021 | 3.14% | 1.25% | ||||||
| Global Micro Cap (GPMCX) | 10/20/2015 | 2.01% | 2.00% | ||||||
| Global Opportunities (GPGOX/GPGIX) | 10/17/2011 | 1.63% | 1.58% | 1.38% | 1.33% | ||||
| Global Reach (GPROX/GPRIX) | 06/19/2013 | 1.50% | 1.50% | 1.25% | 1.25% | ||||
| Global Stalwarts (GGSOX/GGSYX) | 09/01/2015 | 1.27% | 1.27% | 1.03% | 1.03% | ||||
| International Opportunities (GPIOX/GPIIX) | 10/17/2011 | 1.64% | 1.61% | 1.39% | 1.36% | ||||
| International Stalwarts (GISOX/GISYX) | 09/01/2015 | 1.17% | 1.17% | 0.92% | 0.92% | ||||
| Emerging Markets (GEPOX/GPEIX) | 12/16/2013 | 1.83% | 1.81% | 1.58% | 1.56% | ||||
| US Stalwarts (GUSYX) | 03/19/2020 | 0.90% | 0.90% | ||||||
There is no assurance that these opinions or forecasts will come to pass, and past performance is no assurance of future results.
RISKS: Investing in small and micro-cap funds will be more volatile and loss of principal could be greater than investing in large cap or more diversified funds. Investing in foreign securities entails special risks, such as currency fluctuations and political uncertainties, which are described in more detail in the prospectus. Investments in emerging markets are subject to the same risks as other foreign securities and may be subject to greater risks than investments in foreign countries with more established economies and securities markets. Diversification does not eliminate the risk of experiencing investment loss.
A Fund’s direct or indirect investments in foreign securities, including depositary receipts, involve risks not associated with investing in U.S. securities that can adversely affect the Fund’s performance. Foreign markets, particularly emerging markets, may be less liquid, more volatile, and subject to less government supervision than domestic markets.
The adviser’s judgments about the growth, value or potential appreciation of an investment may prove to be incorrect or fail to have the intended results, which could adversely impact the Fund’s performance and cause it to underperform relative to other funds with similar investment goals or relative to its benchmark, or not to achieve its investment goal.
CFA® is a trademark owned by CFA Institute. The Chartered Financial Analyst (CFA) designation is issued by the CFA Institute. Candidates must meet one of the following prerequisites: undergraduate degree and 4 years of professional experience involving investment decision-making, or 4 years qualified work experience (full time, but not necessarily investment related). Candidates are then required to undertake extensive self-study programs (250 hours of study for each of the 3 levels) and pass examinations for all 3 levels.
Grandeur Peak Funds are distributed by Northern Lights Distributors, LLC (Member FINRA/SIPC). Todd Matheny, Jesse Pricer and Amy Johnson are registered representatives of Northern Lights Distributors, LLC, which is not affiliated with Grandeur Peak Global Advisors or its affiliates. ©2025 Grandeur Peak Global Advisors, LLC.
[1] Grandeur Peak Global Advisors – About Us – Global Footprint, https://grandeurpeakglobal.com/global-footprint/
[2] Gross Domestic Product (GDP) is a measure of the value of all goods and services of a country, including spending by consumers, governments, net exports and total investments, and can be used as a measure of a country’s economic health.
[3] Grandeur Peak Home Page – Resources / Fund Literature https://grandeurpeakglobal.com/literature/
[I] The MSCI ACWI Small Cap Index is designed to measure the equity market performance of small-cap companies across developed emerging markets globally.
[II] The MSCI ACWI ex USA Small Cap Index is designed to measure the equity market performance of small cap companies across developed and emerging markets globally, excluding the United States.
[III] Morningstar Foreign Small/Mid Value portfolios invest in international stocks that are smaller and less expensive than other stocks. These portfolios primarily invest in stocks that fall in the bottom 30% of each economically integrated market (such as Europe or Asia ex-Japan). Value is defined based on low valuations (low price ratios and high dividend yields) and slow growth (low growth rates for earnings, sales, book value, and cash flow). These portfolios typically will have less than 20% of assets invested in U.S. stocks.
[IV] Morningstar Global Small/Mid Stock portfolios invest in international stocks that are smaller, growing faster, and higher-priced than other stocks. These portfolios primarily invest in stocks that fall in the bottom 30% of each economically integrated market (such as Europe or Asia ex-Japan). Growth is defined based on fast growth (high growth rates for earnings, sales, book value, and cash flow) and high valuations (high price ratios and low dividend yields). These portfolios typically will have less than 20% of assets invested in U.S. stocks.
[V] The MSCI World Micro Cap Index is designed to measure the equity market performance of micro-cap companies across developed markets globally. It does not include emerging markets.
The MSCI ACWI ex USA Mid Cap Index is designed to measure the equity market performance of mid cap companies across developed and emerging markets globally, excluding the United States.
[VI] Morningstar Foreign Small/Mid-Growth portfolios invest in international stocks that are smaller, growing faster, and higher-priced than other stocks. These portfolios primarily invest in stocks that fall in the bottom 30% of each economically integrated market (such as Europe or Asia ex-Japan). Growth is defined based on fast growth (high growth rates for earnings, sales, book value, and cash flow) and high valuations (high price ratios and low dividend yields). These portfolios typically will have less than 20% of assets invested in U.S. stocks.
[VII] The MSCI ACWI Mid Cap Index is designed to measure the equity market performance of mid-cap companies across developed and emerging markets globally.
[VIII] The MSCI ACWI ex USA Mid Cap Index is designed to measure the equity market performance of mid cap companies across developed and emerging markets globally, excluding the United States.
[IX] The MSCI Emerging Markets SMID Cap Index is designed to measure the equity market performance of small and mid-cap companies across emerging markets.
[X] Morningstar Diversified Emerging Markets portfolios tend to divide their assets among 20 or more nations, although they tend to focus on the emerging markets of Asia and Latin America rather than on those of the Middle East, Africa, or Europe. These portfolios invest predominantly in emerging market equities, but some funds also invest in both equities and fixed income investments from emerging markets.
[XI] The MSCI USA Mid-Cap Index is designed to measure the performance of the mid-cap segments of the US market. With 340 constituents, the index covers approximately 15 percent of the free float-adjusted market capitalization in the US.
[XII] The MSCI USA Small Cap Index is designed to measure the performance of the small-cap segment of the US equity market. With 1,781 constituents, the index represents approximately 14 percent of the free float-adjusted market capitalization in the US. MSCI makes no express or implied warranties or representations and shall have no liability whatsoever with respect to any MSCI data contained herein. The MSCI data may not be further redistributed or used to create indices or financial products. You cannot invest directly in any index.
[XIII] Morningstar Mid-Cap Growth portfolios invest in stocks of all sizes, thus leading to a mid-cap profile, but others focus on midsize companies. Mid-cap growth portfolios target U.S. firms that are projected to grow faster than other mid-cap stocks, therefore commanding relatively higher prices. Stocks in the middle 20% of the capitalization of the U.S. equity market are defined as mid-cap. Growth is defined based on fast growth (high growth rates for earnings, sales, book value, and cash flow) and high valuations (high price ratios and low dividend yields).