Search
Close this search box.

Overview

Fund Description

Investment Objective

The Fund’s investment objective is long-term growth of capital.

Investment Strategy

The Fund invests primarily in companies economically tied to U.S. or foreign markets.

Portfolio Manager

Brad Barth
Research Analyst & Portfolio Manager
Deputy Chief Investment Officer

Randy Pearce, CFA®
Research Analyst & Portfolio Manager
Chief Investment Officer

Guardian Portfolio Manager

Phil Naylor
Research Analyst & Portfolio Manager

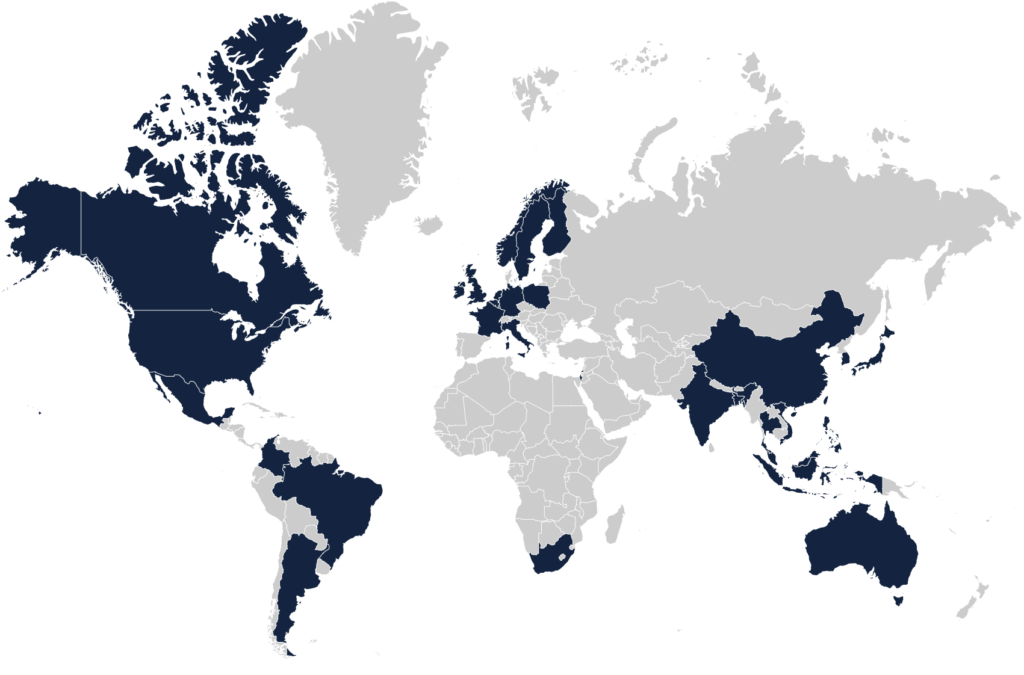
Representative Geography

Fund Information

Fund Data & Pricing

As of As of Date Goes Here

Benchmarks

PrimaryMSCI ACWI Mid Cap Index
MSCI ACWI Mid Cap Index The MSCI ACWI Mid Cap Index is designed to measure the equity market performance of mid-cap companies across developed and emerging markets globally.
SecondaryMSCI ACWI Small Cap Index
MSCI ACWI Small Cap Index The MSCI ACWI Small Cap Index is designed to measure the equity market performance of small cap companies across developed and emerging markets globally.
You cannot invest directly in these or any indices.

Performance

Fund inception of 09/01/2015

Month end as of As of Date Goes Here

The performance data quoted represents past performance. Current performance may be lower or higher than the performance data quoted above. Past performance is no guarantee of future results. The investment return and principal value of an investment will fluctuate so that investor’s shares, when redeemed, may be worth more or less than their original cost. For performance information current to the most recent month-end, please call 1.855.377.PEAK (7325).

Returns for periods greater than one year are annualized. The Advisor may absorb certain Fund Expenses, without which total return would have been lower. Net expense ratios reflect the expense waiver, if any, contractually agreed to through October 6, 2024. A 2% redemption fee will be deducted on fund shares held 60 days or less. Performance data does not reflect this redemption fee or taxes.

Quarter end as of As of Date Goes Here

The performance data quoted represents past performance. Current performance may be lower or higher than the performance data quoted above. Past performance is no guarantee of future results. The investment return and principal value of an investment will fluctuate so that investor’s shares, when redeemed, may be worth more or less than their original cost. For performance information current to the most recent month-end, please call 1.855.377.PEAK (7325).

Returns for periods greater than one year are annualized. The Advisor may absorb certain Fund Expenses, without which total return would have been lower. Net expense ratios reflect the expense waiver, if any, contractually agreed to through October 6, 2024. A 2% redemption fee will be deducted on fund shares held 60 days or less. Performance data does not reflect this redemption fee or taxes.

Year end as of 12/31/2023

wdt_ID 2023 2022 2021 2020 2019 2018 2017 2016
1 Grandeur Peak Global Stalwarts Fund - Institutional 17.19% -39.39% 21.22% 41.13% 32.34% -14.90% 31.58% 8.29%
2 MSCI All Country World Index Small Cap - GR 17.41% -18.27% 16.54% 16.83% 25.23% -14.03% 24.32% 12.10%
3 MSCI All Country World Index Mid Cap - GR 15.93% -18.37% 16.84% 15.65% 26.60% -12.88% 24.98% 7.70%

The performance data quoted represents past performance. Current performance may be lower or higher than the performance data quoted above. Past performance is no guarantee of future results. The investment return and principal value of an investment will fluctuate so that investor’s shares, when redeemed, may be worth more or less than their original cost. For performance information current to the most recent month-end, please call 1.855.377.PEAK (7325).

Returns for periods greater than one year are annualized. The Advisor may absorb certain Fund Expenses, without which total return would have been lower. Net expense ratios reflect the expense waiver, if any, contractually agreed to through October 6, 2024. A 2% redemption fee will be deducted on fund shares held 60 days or less. Performance data does not reflect this redemption fee or taxes.

Historical Price (NAV)

As of As of Date Goes Here, updated quarterly

Hypothetical Growth of $10,000

As of As of Date Goes Here

Portfolio Characteristics

As of 6/30/24, updated quarterly, subject to change.

Estimated 3-Year EPS Growth
Estimated 3-Year EPS Growth Estimated weighted average annual increase in Earnings Per Share (EPS) of the fund's holdings over the next 3 years. These returns are not guaranteed. Actual EPS growth may be higher or lower.
17.9%
Trailing P/E
Trailing P/E The trailing 12-month Price/Earnings (P/E) of the portfolio, calculated as a weighted harmonic average.
31.8
Return on Assets
Return on Assets Return on Assets (ROA) is a measure of how efficiently a company uses its assets to generate a profit, and is calculated by dividing company’s net income by total assets.
8.9%
Operating Margin
Operating Margin Operating Margin is a measurement of what proportion of a company's revenue is left over after paying for variable costs of production such as wages, raw materials, etc. It is calculated by dividing Operating Income by Net Sales.
16.2%
Debt/Equity
Debt/Equity Debt/Equity is a measure of a company's financial leverage. It is calculated by dividing its total liabilities by stockholders' equity.
76%
Weighted Average Market Cap ($millions)
Weighted Average Market Cap The average market capitalization of companies held by the fund, weighted in proportion to their percentage of net assets in the fund.
$11,870
Median Market Cap ($millions)
Median Market Cap The median market cap is the midpoint of market capitalization of companies held by the fund.
$5,895
Number of Holdings148
Portfolio Turnover
Portfolio Turnover A measure of annual trading activity in the fund's portfolio, expressed as a percent.
47%

Equity Portfolio Composition

Access All Fund Holdings

Download XLS

Access All Fund Holdings

Download XLS

Top 10 Holdings

As of 04/30/2024, updated quarterly, subject to change

Company Name Country Sector % of Net Assets
1Littelfuse, Inc.United StatesIndustrials3.5%
2B & M European Value Retail SABritainConsumer Staples3.2%
3Silergy CorpChinaTechnology2.9%
4BayCurrent Consulting, Inc.JapanTechnology2.5%
5Pjt Partners, Inc.United StatesFinancials1.8%
6Melexis NVBelgiumTechnology1.7%
7Virbac SAFranceHealth Care1.5%
8Ashtead Group plcUnited StatesIndustrials1.5%
9Crowdshare Holdings, Inc.United StatesTechnology1.5%
10Darktrace plcBritainTechnology1.5%
Total Top 10 Holdings21.5%

Holdings are released based on a 60-day lag from the most recent quarter end according to the Grandeur Peak Holdings Release Policy. Holdings are subject to change and do not constitute a recommendation or solicitation to buy or sell a particular security. Current and future holdings are subject to risk. Total amount subject to rounding.

Sector Weights

As of As of Date Goes Here, updated quarterly, subject to change

Market Capitalization

As of As of Date Goes Here, updated quarterly, subject to change

Regions

As of As of Date Goes Here, updated quarterly, subject to change
% of Total Equities
North America47.9%
Europe27.2%
Asia ex Japan14.4%
Japan6.8%
Latin America3.0%
Africa/Middle East1.0%
Australia/New Zealand0.6%
Total 100.0%
Values may sum to greater or less than 100% due to rounding.

Top 5 Countries

As of As of Date Goes Here, updated quarterly, subject to change
% of Total Equities
1United States43.2%
2Britain8.7%
3Japan6.8%
4Sweden4.2%
5Taiwan3.7%
Total Top 5 Countries66.6%

Cash & Equivalents

As of As of Date Goes Here, updated quarterly, subject to change
Cash & Equivalents0.9%

Literature