Share Class
Capitalization
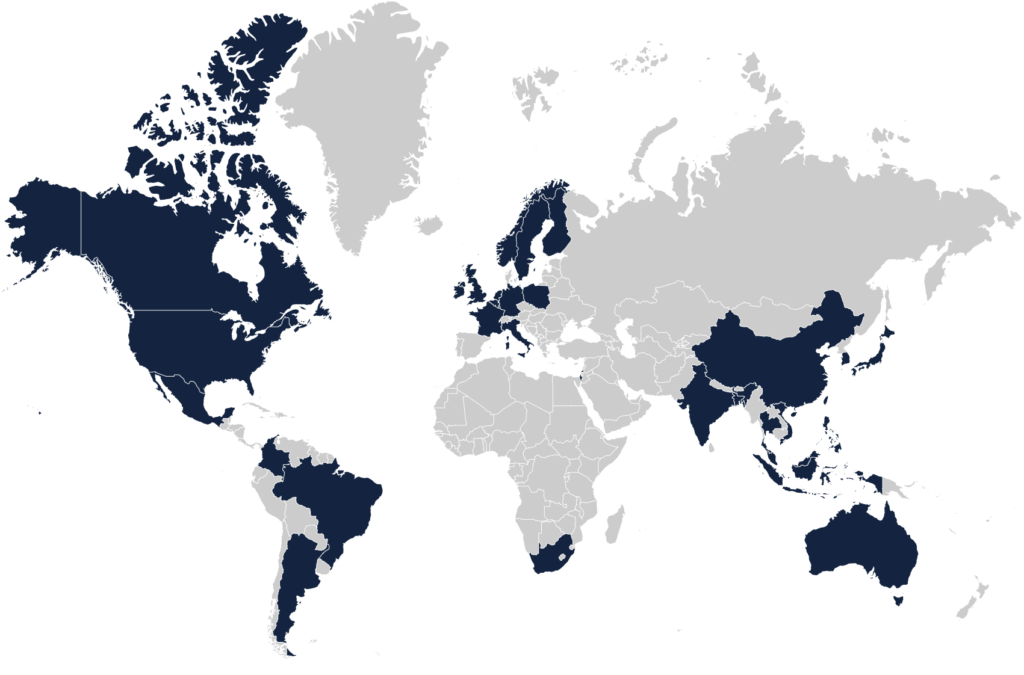
Geography
Inception
Robert Gardiner, CFA®
Research Analyst & Portfolio Manager
Chairman & Co-Founder
Dane Nielson, CFA®
Research Analyst & Portfolio Manager
Blake Walker
Research Analyst & Portfolio Manager
Chief Executive Officer
Spencer Hackett
Research Analyst & Portfolio Manager
MSCI ACWI Small Cap Indexⓘ
MSCI ACWI Small Cap Index
The MSCI ACWI Small Cap Index is designed to measure the equity market performance of small-cap companies across developed and emerging markets globally.
|
Morningstar Category Average: Foreign Small/Mid Valueⓘ
Foreign Small/Mid Value
Foreign small/mid-value portfolios invest in international stocks that are smaller and less expensive than other stocks. These portfolios primarily invest in stocks that fall in the bottom 30% of each economically integrated market (such as Europe or Asia ex-Japan). Value is defined based on low valuations (low price ratios and high dividend yields) and slow growth (low growth rates for earnings, sales, book value, and cash flow). These portfolios typically will have less than 20% of assets invested in U.S. stocks.
|
Fund inception of 09/17/2019
The performance data quoted represents past performance. Current performance may be lower or higher than the performance data quoted above. Past performance is no guarantee of future results. The investment return and principal value of an investment will fluctuate so that investor’s shares, when redeemed, may be worth more or less than their original cost. For performance information current to the most recent month-end, please call 1.855.377.PEAK (7325).
Returns for periods greater than one year are annualized. The Advisor may absorb certain Fund Expenses, without which total return would have been lower. Net expense ratios reflect the expense waiver, if any, contractually agreed to through September 1, 2026. A 2% redemption fee will be deducted on fund shares held 30 days or less. Performance data does not reflect this redemption fee or taxes.
Year end as of 12/31/2024
wdt_ID | 2024 | 2023 | 2022 | 2021 | 2020 | |
---|---|---|---|---|---|---|
1 | Grandeur Peak Global Contrarian - Institutional | 14.93% | 21.30% | -14.61% | 19.97% | 24.97% |
2 | MSCI ACWI Small Cap Index | 7.66% | 16.84% | -18.67% | 16.09% | 16.33% |
3 | Morningstar Category Average: Foreign Small/Mid Value |
5.21% | 16.82% | -11.03% | 14.87% | 8.61% |
The performance data quoted represents past performance. Current performance may be lower or higher than the performance data quoted above. Past performance is no guarantee of future results. The investment return and principal value of an investment will fluctuate so that investor’s shares, when redeemed, may be worth more or less than their original cost. For performance information current to the most recent month-end, please call 1.855.377.PEAK (7325).
Returns for periods greater than one year are annualized. The Advisor may absorb certain Fund Expenses, without which total return would have been lower. Net expense ratios reflect the expense waiver, if any, contractually agreed to through September 1, 2026. A 2% redemption fee will be deducted on fund shares held 30 days or less. Performance data does not reflect this redemption fee or taxes.
As of 06/30/25, updated quarterly, subject to change.
Trailing P/Eⓘ
Trailing P/E
The trailing 12 month Price/Earnings (PE) of the portfolio, calculated using the Index methodology.
| 13.6 |
Return on Assetsⓘ
Return on Assets
Return on Assets (ROA) is a measure of how efficiently a company uses its assets to generate a profit, and is calculated by dividing company’s net income by total assets.
| 10.0% |
Operating Marginⓘ
Operating Margin
Operating Margin is a measurement of what proportion of a company's revenue is left over after paying for variable costs of production such as wages, raw materials, etc. It is calculated by dividing Operating Income by Net Sales.
| 18.6% |
Debt/Equity ⓘ
Debt/Equity
Debt/Equity is a measure of a company's financial leverage. It is calculated by dividing its total liabilities by stockholders' equity.
| 73% |
Weighted Average Market Cap ($millions)ⓘ
Weighted Average Market Cap
The average market capitalization of companies held by the fund, weighted in proportion to their percentage of net assets in the fund.
| $6,070 |
Median Market Cap ($millions)ⓘ
Median Market Cap
The median market cap is the midpoint of market capitalization of companies held by the fund.
| $1,129 |
Number of Holdings | 96 |
Portfolio Turnoverⓘ
Portfolio Turnover
A measure of annual trading activity in the fund's portfolio, expressed as a percent.
| 77% |
Access All Fund Holdings
Download XLSAccess All Fund Holdings
Download XLSAs of 04/30/2025, updated quarterly, subject to change
Company Name | Country | Sector | % of Net Assets | |
---|---|---|---|---|
1 | B & M European Value Retail SA | Britain | Consumer Staples | 3.2% |
2 | Rise Consulting Group Inc | Japan | Industrials | 3.2% |
3 | Marex Group PLC | Britain | Financials | 2.4% |
4 | Petershill Partners PLC | Britain | Financials | 2.3% |
5 | P10 Inc | United States | Financials | 2.2% |
6 | CVS Group plc | Britain | Health Care | 2.1% |
7 | Grocery Outlet Holding Corp | United States | Consumer Staples | 2.0% |
8 | Dollar General Corporation | United States | Consumer Staples | 2.0% |
9 | Riverstone Holdings Ltd. | Singapore | Health Care | 1.8% |
10 | Arizona Sonoran Copper Co Inc | United States | Materials | 1.8% |
Total Top 10 Holdings | 22.9% |
Holdings are released based on a 60-day lag from the most recent quarter end according to the Grandeur Peak Holdings Release Policy. Holdings are subject to change and do not constitute a recommendation or solicitation to buy or sell a particular security. Current and future holdings are subject to risk. Total amount subject to rounding.
% of Total Equities | |
---|---|
North America | 30.3% |
Europe | 29.2% |
Asia ex Japan | 16.5% |
Japan | 14.8% |
Australia/New Zealand | 5.5% |
Latin America | 3.7% |
Total | 100.0% |
% of Total Equities | ||
---|---|---|
1 | United States | 25.6% |
2 | Japan | 14.8% |
3 | Britain | 14.8% |
4 | Australia | 5.5% |
5 | China | 4.2% |
Total Top 5 Countries | 64.9% |
Cash & Equivalents | 2.6% |