
Contents
Market Commentary
Portfolio Commentary
Notes from the Road
Business Update
Total Returns | As of March 31, 2025
Market Commentary
Key Takeaways
- Assets that carry a margin of safety are those that are believed to have less risk of loss in a market downturn. Assets with a margin of risk are those that have a higher risk of loss in a market downturn.
- Within the equity style framework, growth stocks may carry a higher margin of risk than value stocks given their valuation is largely determined by future growth.
- Given looming geopolitical and economic uncertainty, investors have been reluctant to invest in foreign growth stocks over the past five years. As a result, foreign growth stocks have significantly underperformed foreign value stocks.
- Conversely, investors have been more willing to invest in growth stocks in the US market, as growth has meaningfully outperformed value.
- During Q1 ’25, concerns regarding US trade policy sparked a sell-off in risk assets. The US growth market was not immune, as it underperformed other segments of the global equity market, reminding investors of their margin of risk.
- Within foreign markets, investors’ preference for value stocks has caused lower quality or cigar butt stocks (i.e. those with low returns on capital and high leverage) to outperform.
- The rally in low quality foreign stocks can be observed within mutual fund return data. The funds with the lowest Morningstar assigned quality score within the Foreign Small/Mid Cap category have outperformed over the past 4 consecutive years.
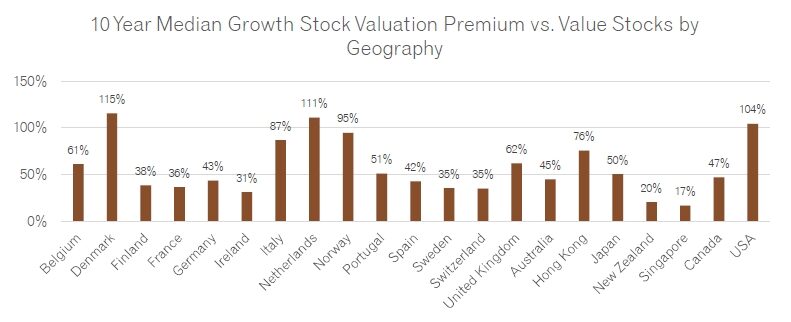
- The outperformance of value stocks within foreign small cap markets has also led to a significant reduction in the valuation premium that growth stocks typically command within several countries.
- We believe the low-quality stock rally has persisted for too long. Eventually, stock prices will have to reconcile with fundamentals. When they do, we believe that those who are invested in higher quality stocks will be rewarded.
Margin of Safety / Margin of Risk
The term “margin of safety” was coined by Ben Graham, who is known as the father of value investing and a mentor to Warren Buffet. It refers to buying an asset that is below its intrinsic or fair market value, which reduces the risk of loss if market conditions become unfavorable.
The opposite condition is called “margin of risk,” where an asset is overvalued or trading above its intrinsic value and, therefore, more susceptible to the risk of loss.
Within the equity market’s growth-value style framework, value stocks arguably offer some margin of safety, given they typically trade at relatively low valuations and a discount to their book value. On the other hand, some believe that growth stocks carry a higher margin of risk, given they typically trade at higher valuations that hinge more heavily on prospective growth rather than historic or current earnings generation.
When economic conditions are favorable and investors are more willing to take risks, assets that carry a higher margin of risk may generate higher returns, while assets with a higher margin of safety may underperform, and vice versa. However, this is not always the case.
Given existing geopolitical risks, uncertainty surrounding the impact of artificial intelligence, the future path of interest rates, inflationary pressures, etc., investors have shied away from investing in foreign growth stocks and have preferred to own value stocks that, at least on their surface, offer a higher margin of safety. As a result, over the past three calendar years, growth has meaningfully underperformed value across the cap spectrum. As US trade protectionist policies escalated in Q1 ’25, foreign growth stocks continued to underperform.
Exhibit 1
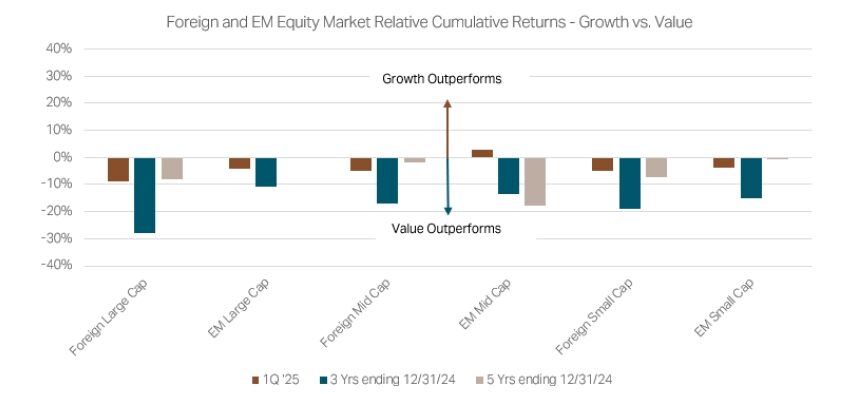
Source: Factset, MSCI Indices, 2019-2025
Within the US market, investors have been much more comfortable investing in stocks, which arguably carry a high margin of risk, as the price-earnings multiple1 is well above its long-term historical average. Furthermore, the margin of risk has been amplified by the current concentration risk in the S&P 500 index, where the top ten stocks account for nearly 35%2 of its market capitalization. Regardless, investors have been rewarded for assuming these risks as the S&P 500 Index outperformed all other segments of the global equity market by +26.00% and +70.01% on a cumulative basis over the 3-year and 5-year periods ending 12/31/243. The favorable US market returns have persuaded many investors to reduce allocations to other segments of the global equity market and increase US large cap exposure, thus reducing diversification and increasing their overall asset allocation’s margin of risk.
The US market’s dominance has been primarily driven by large cap growth stocks, which outperformed large cap value stocks by 21.58% and 105.27% on a cumulative basis over the 3-year and 5-year periods ending 12/31/244. Within the US market, investors have disregarded many of the same macro concerns that have kept them from investing in non-US growth markets. Yet, in Q1 ’25, uncertainty regarding the impact of the Trump tariffs was too much to ignore and the US large cap market underperformed the rest of the world by -9.37% (-4.78% versus +4.59%)5, as US large cap growth stocks fell by -11.22%6, correlating with the rest of the global growth equity market. Despite the underperformance, US stocks still command a substantial valuation premium versus the rest of the world. Any meaningful reversion to long term valuation averages, absolute and relative, would require much more significant underperformance by US markets in the future.
Exhibit 2
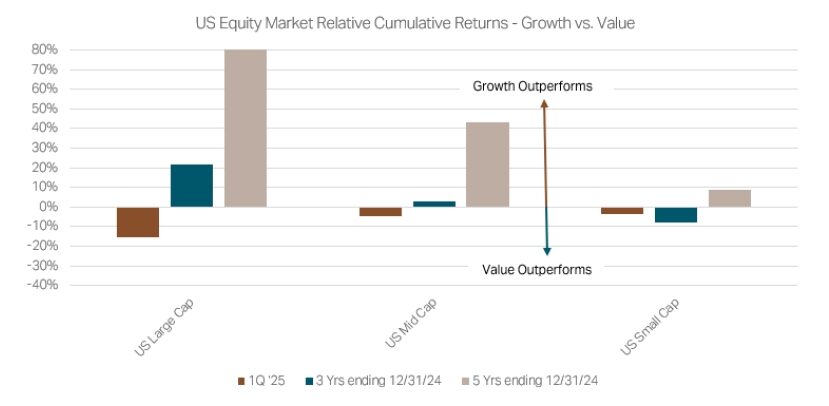
Source: Factset, MSCI Indices 2019-2025
Cigar Butt Foregin Stock Rally
Years ago, Warren Buffet referred to the strategy of investing in companies with poor fundamentals, trading at dirt cheap valuations as the “cigar butt” approach to investing. You invest in the companies because you “think there is one good free puff left in it.” He added,
“If you have a business that is earning 5-6% on equity and you hold it for a long time, you are not going to do well in investing. Even if you buy it cheap to start with. Time is the enemy of the poor business and it’s the friend of the great business. If you have a business that is earning 20-25% on equity, time is your friend, but time is your enemy if you have your money in a low return business.”7
Over the past four years, many investors have concluded that very cheap value stocks offer a high margin of safety, preferring to bid up the prices of these stocks in lieu of buying much higher quality stocks with significant growth potential at higher valuations. Fortunately for them, this strategy has worked in their favor as they have gotten several good “puffs” out of them. However, as Buffet noted, time is an enemy to businesses that generate a low return on capital. We believe the fundamentals will eventually favor higher quality businesses with higher returns on capital, and those investors caught holding the cigar butts will realize their margin of safety stocks carry a lot more margin of risk than they realize.
The foreign “cigar butt” market rally can be observed clearly in the mutual fund performance data. In Exhibit 3, we organized all the funds in the Morningstar Foreign Small/Mid cap category into quality quintiles (i.e., five 20% cohorts) based on their Morningstar-assigned quality rating8. Morningstar assigns each fund a quality rating based on the fund’s profitability (i.e., return on equity) and leverage (i.e., debt to equity). The higher the profitability and lower the leverage, the higher the quality score. The quintile of funds with the lowest average quality rating (i.e., the “cigar butt” funds) have outperformed the other four higher quality quintiles for the last four consecutive calendar years and during the first quarter of 2025. The run that the cigar butts have had is unprecedented, but we believe cannot be fundamentally sustained. In due time low quality investing will fall out of favor and high quality and sound fundamentals will again be appreciated by investors.
Exhibit 3
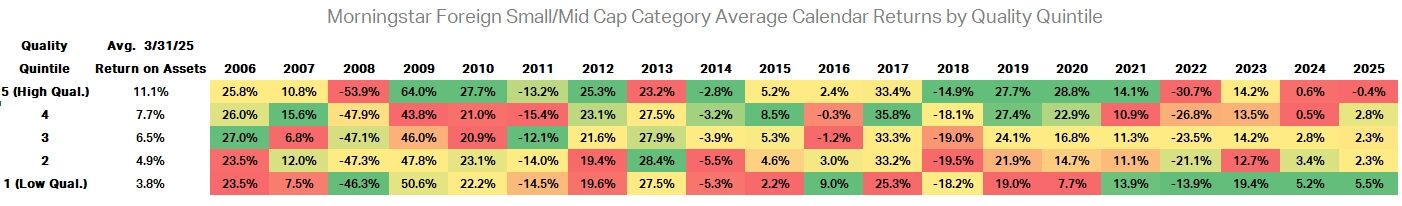
Source: Morningstar Direct, March 31, 2025
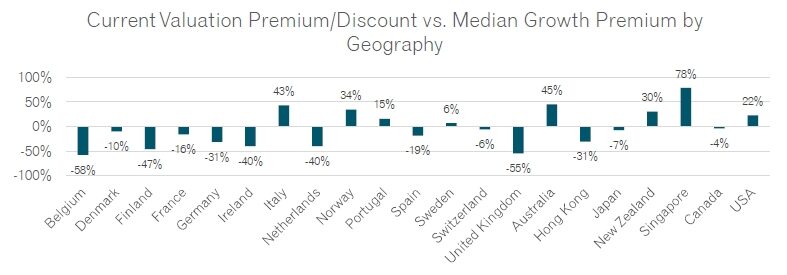
Within the small cap market, the underperformance realized in foreign growth markets coupled with better earnings relative to foreign value markets has reduced the valuation premium that growth stocks typically command in many geographies. This can especially be observed in many Western European countries, where premiums are 25-50% lower than their 10-year median valuation premium.
Exhibit 4
Source: Factset, MSCI, 2015-2025
Exhibit 5
Source: Factset, MSCI, 2015-2025
‘Hallelujah Chorus’
Warren Buffet once said, “When hamburgers go down in price, we sing the ‘Hallelujah Chorus’ in the Buffett household. When hamburgers go up in price, we weep. For most people, it’s the same with everything in life they will be buying — except stocks. When stocks go down and you can get more for your money, people don’t like them anymore.”
Foreign small cap growth stocks, especially the higher-quality variety, have indeed gone down. In fact, they have not traded at such low valuations over two decades. The extraordinary flows out of foreign small cap growth funds over the past three years provides evidence that, in fact, investors don’t seem to “like them anymore”.
Exhibit 6
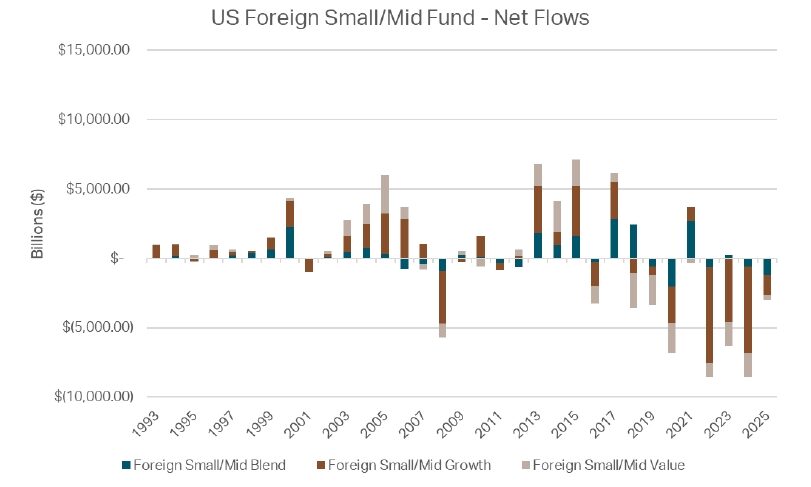
Source: Morningstar Direct, 1993-2025
While we are disappointed with the price performance of many of our portfolios over the past three years, we remain very confident in the underlying business quality of the companies we have invested in. Despite falling valuations, we take great comfort in the fact that our portfolios are generating strong earnings growth in aggregate. In other words, at the fundamental level, we believe our portfolios offer a very high margin of safety and that time is on our side. When markets stabilize and valuations recover, we are confident that our portfolios will as well. When they do, it will give us another reason to sing a ‘Hallelujah Chorus’ and we hope you will stick with us until then.
Portfolio Commentary
As of mid-April, the first quarter already feels like a distant memory and much less relevant than what has occurred over the last few weeks. We’ll begin the portfolio commentary with a current snapshot through mid-April and end with Q1 attribution.
The most important point we want to make is that market uncertainty is very exciting for us as an active manager. We believe this environment is “teeing up the ball” for the coming months and years. It feels similar to the early weeks of COVID, when there were countless questions and few answers. We were able to use that period to increase the quality of our portfolios at highly attractive valuations.
Regarding where we stand now, we have many questions without good answers. Is American exceptionalism over? Will the US and China come to the table for a trade agreement? Can the US realistically reshore manufacturing? The list goes on.
While there is much that we do NOT know, one thing we DO know is that we have been able to use this period of uncertainty to increase and focus the quality of our portfolios. If this uncertainty continues, we strongly believe that quality will outperform. We are seeing early indications of this as each of our funds is performing as we would anticipate in the first two weeks of April.
Our growth funds have reduced their number of holdings by an average of 15% over the last six months. This is a function of high conviction names accessible at increasingly attractive valuations. We have leveraged the recent volatility to add more weight behind our best ideas across all sectors and geographies.
Moving on to Q1 attribution, Global Micro Cap and Global Contrarian funds outperformed their benchmarks in the quarter. The main drivers were a large weight in a Hong Kong-based technology company that was up nearly 50%, plus a significant underweight to the US, which was one of the worst performing countries in the index.
Our other funds had a more difficult time in the first quarter. However, it’s important to note that we use a blend benchmark (not growth or value), because we aim to outperform a blend benchmark over a reasonable period and are comfortable owning more value-oriented names when appropriate. In addition to comparing our performance to the blend benchmark, it also makes sense to look at how we stack up to the growth version of the benchmark. As a result, many of our funds ended Q1 roughly in line with the growth indices.
The Stalwarts portfolios were an exception. While their absolute returns were similar to our small-cap funds, the mid-cap indices performed quite a bit better than the small-cap indices, making their relative performance appear weaker.
What worked and what didn’t in Q1?
Japan was a bright spot across several of our funds. Our holdings in the country had a good earnings season. Trends in cloud penetration and digitization are accelerating, and we are well positioned to benefit. A consulting company we own across several funds gained 28.25% in Q1 and 120.00% over the last 12 months, contributing nicely.
Health Care was a strong performing sector relative to the bench despite macro challenges (NIH cuts, potential pharma tariffs, threats to Medicare/Medicaid/etc.). Our underweights to the US and emerging markets, along with an overweight to developed ex-US, were additive. Our 0% allocation to biotechnology and strong performance from a UK veterinary practice (+23.18% in Q1), were also beneficial. The vet practice has been a larger position for us, it was one of those names that has been tough over the last few years, but we’ve been patient and are starting to see the payoff.
Our Industrials tranche struggled in the quarter, particularly those names tied to industrial construction, infrastructure, and data centers. These industries were affected by jitters in the market surrounding the launch of Deepseek (a Chinese AI firm) and news that Microsoft is reducing its capital expenditures.
While tariff concerns have been pushed to the forefront, we’ve been considering this risk for a while and have reduced exposure to many companies heavily reliant on international manufacturing and which sell into the US. Where we do have export exposure, we make sure it’s A) limited and B) they’re not going to be more negatively affected than their peers. We also own industrial companies characterized by strong returns on capital, solid balance sheets, defensible margins, and generally less cyclical business models. This gives us confidence heading into any potential US slowdown.
Financials underperformed in Q1, with the exception of emerging markets. Within the sector, we have an overweight to financial services (capital markets) and underweights to banking, insurance, and real estate. Our allocation was a negative contributor, as those areas where we’re underexposed had much better performance than financial services. Our investments in independent advisors and alternative managers were a drag as the market penalized this type of exposure in an environment of rising uncertainty. However, we remain confident in the quality and resilience of our holdings.
Consumer exposure was frustrating as our companies are growing their earnings well. The consumer tranche of Global Reach was -8.2% in Q1 with earnings growth of +15.2%. Our performance was good in consumer staples, but difficult in consumer discretionary.
We believe we own great consumer companies at compelling valuations, and we feel excited about the direction we are headed. We’ve been able to increase the returns on capital in recent months through rotation and by reducing name count to focus our efforts. We are optimistic that our portfolios can outperform through the cycle.
Notes from the Road
Company Touch Tracker
This quarter our team engaged with 455 companies across the world, putting our trailing 12-month company touches at 1,707.
In Q1, team members traveled domestically to Massachusetts, Minnesota, Kentucky, Utah, California, and Florida. Internationally, team members traveled to Japan, Sweden, and the United Kingdom and interacted with companies in 32 other countries. We track these interactions and share them on our Company Touch Tracker9.
United Kingdom Recap
Alex Watson, Juliette Douglas, and Phil Naylor, Research Analysts, traveled to the United Kingdom in January. Here are some of Alex’s thoughts on their research trip.
We met with both portfolio and prospective companies-mostly in London and surrounding areas. With Phil leading our Technology team, many meetings had a tech focus. The trip was efficient, and we met with a total of 25 companies over five days.
Where eligible, our portfolios have held an overweight to the United Kingdom for many years. As bottom-up investors, we have found and continue to find many high-quality, growth companies at attractive valuations in this region. The UK has faced headwinds—Brexit, COVID, and energy inflation after the 2022 Ukraine invasion. The UK now has the second-highest energy costs in the G7, after Italy.10,11, Government subsidies helped, but were not fully funded by spending cuts or tax increases, exacerbating inflationary cost pressures for UK-based companies and consumers.
Policy changes from the Labour government, including an increase to the National Insurance Contribution (NIC) and a reduction in AIM12 inheritance tax benefits (effective April 2026), have impacted sentiment. Some AIM-listed companies are even considering moving to the main market, and one company we met with may relocate its headquarters to Ireland. Nearly all the management teams we met expressed their dissatisfaction with the Labour Party, despite the party’s proclamations in support of business growth.
These policies have created an inflationary environment, and many companies are likely to pass along the additional labor costs to their customers. Those companies which cannot pass on the additional costs are likely to find ways to automate or offshore their business functions to avoid the additional expenses. Some UK companies we met with said that because of these UK-specific challenges, they will be prioritizing the non-UK segments of their business.
Despite three consecutive years of negative AIM index returns (2022-24), we believe these policy changes have limited financial impact on the companies we own. Relative to the FTSE 25013 and the Russell 200014 indices, AIM has underperformed by 53.20% and 41.10% respectively since Jan 2021.
Even with these macro headwinds, the UK remains a source of opportunity. The MSCI United Kingdom Small Cap Growth index trailing P/E ratio15 is currently 13.9, well below its 10-year average of 26.4. We continue to find many well-run companies at very reasonable prices.
Acquisitive companies, or “compounders” as we often call them, can take advantage of their group strength to buy businesses that might be challenged on their own. Certain exporters, or businesses with more significant global presence, have also been continuing to deliver on their strategic objectives by taking advantage of stronger demand in other parts of the world. Some businesses are also benefiting from increasing regulatory complexity.
We acknowledge the UK small-cap growth space has been a contrarian position. However, shifting sentiment may lead to repatriation of foreign assets from the US. The UK’s relatively neutral trade relationship with the US could also shield it from potential tariff impacts16 – another potential tailwind for our UK overweight.
Over the long term, we believe financial performance matters more than asset flows, and we believe that by owning high quality companies, we could once again be handsomely rewarded, hopefully in the not-too-distant future.
Business Update
We’re pleased to announce Amy A Hone, IACCP® has been promoted to Chief Compliance Officer (CCO). She previously served as Deputy CCO, and VP Operations & Trading and recently received the Investment Adviser Certified Compliance Professional designation. Amy succeeds Jeff Vincent, JD, who remains as General Counsel, and will begin a three-year sabbatical this summer, transitioning responsibilities by May 2025. He is expected to return around July 2028.
During the quarter, Blake Walker has been named Portfolio Manager (PM) of the Grandeur Peak Global Contrarian Fund, following the departure of Portfolio Manager, Mark Madsen in February. Mark left the firm to pursue a new opportunity.
We anticipate Robert Gardiner, Chairman of Grandeur Peak, and co-founder, will return as Portfolio Manager of the Global Contrarian Fund when he returns to a full-time role in July 2025, following his three-year service sabbatical. Robert was Guardian PM on the Fund for the first three years and is a strong believer in Global Contrarian. He pioneered the idea of a value fund in a growth shop, having previously launched small- and micro-cap value funds. The Fund continues to be supported by the efforts of the entire Grandeur Peak Research Team, and Lead Analyst, Dane Nielson, CFA®. Dane is also a Portfolio Manager of the Grandeur Peak Global Explorer Fund.
We believe one of the most distinguishing features of Grandeur Peak is that all of our portfolios rely heavily on the work done by our sector and geography teams. This team-driven structure allows us to fully leverage our “multiple minds” investment philosophy and to mitigate key person risk.
For copies of our recently updated ADV, please visit the following link17. Our funds remain open for investment for direct shareholders and through multiple distribution networks.
As always, please feel free to reach out any time with any questions, requests, or comments. We appreciate the opportunity to work on your behalf.
Sincerely,
Todd Matheny, CAIA®
Jesse Pricer, CFA®
Amy Johnson, CFP®
The Grandeur Peak Client Team
Total Returns | As of March 31, 2025
| CUMULATIVE | ANNUALIZED | |||||||
| QTR | YTD | 1 YR | 3 YR | 5 YR | 10 YR | SINCE FUND INCEPTION | ||
| Global Contrarian, Institutional Class (GPGCX) | -1.55% | -1.55% | 10.49% | 6.80% | 19.93% | n/a | 12.56% | |
| MSCI ACWI Small Cap IndexI | -3.86% | -3.86% | -0.04% | 2.06% | 14.21% | n/a | 7.19% | |
| MSCI ACWI ex USA Small Cap IndexII | 0.64% | 0.64% | 1.87% | 0.99% | 11.84% | n/a | 5.85% | |
| Morningstar Category Average: Foreign Small/Mid ValueIII | 6.28% | 6.28% | 8.15% | 6.40% | 15.09% | n/a | n/a | |
| Global Explorer, Institutional Class (GPGEX) | -4.77% | -4.77% | -4.04% | -3.91% | n/a | n/a | -7.51% | |
| MSCI ACWI Small Cap Index | -3.86% | -3.86% | -0.04% | 2.06% | n/a | n/a | 1.00% | |
| Morningstar Category Average: Global Small/Mid StockIV | -3.57% | -3.57% | -2.64% | -2.49% | n/a | n/a | n/a | |
| Global Micro Cap, Institutional Class (GPMCX) | -0.99% | -0.99% | 0.60% | -1.57% | 13.43% | n/a | 8.06% | |
| MSCI World Micro Cap IndexV | -1.55% | -1.55% | 1.76% | -2.37% | 12.20% | n/a | 6.31% | |
| MSCI ACWI Small Cap Index | -3.86% | -3.86% | -0.04% | 2.06% | 14.21% | n/a | 7.67% | |
| Morningstar Category Average: Foreign Small/Mid GrowthVI | 0.14% | 0.14% | -0.41% | -1.44% | 8.24% | n/a | n/a | |
| Global Opportunities, Institutional Class (GPGIX) | -6.47% | -6.47% | -11.26% | -7.76% | 8.79% | 5.72% | 9.25% | |
| Global Opportunities, Investor Class (GPGOX) | -6.33% | -6.33% | -11.30% | -7.91% | 8.55% | 5.48% | 8.99% | |
| MSCI ACWI Small Cap Index | -3.86% | -3.86% | -0.04% | 2.06% | 14.21% | 6.85% | 9.04% | |
| Morningstar Category Average: Global Small/Mid Stock | -3.57% | -3.57% | -2.64% | -2.49% | 10.87% | 4.93% | n/a | |
| Global Reach, Institutional Class (GPRIX) | -4.30% | -4.30% | -2.54% | -4.83% | 9.83% | 6.25% | 7.83% | |
| Global Reach, Investor Class (GPROX) | -4.41% | -4.41% | -2.89% | -5.07% | 9.55% | 5.99% | 7.57% | |
| MSCI ACWI Small Cap Index | -3.86% | -3.86% | -0.04% | 2.06% | 14.21% | 6.85% | 7.70% | |
| Morningstar Category Average: Global Small/Mid Stock | -3.57% | -3.57% | -2.64% | -2.49% | 10.87% | 4.93% | n/a | |
| Global Stalwarts, Institutional Class (GGSYX) | -6.87% | -6.87% | -7.91% | -8.12% | 7.02% | n/a | 6.53% | |
| Global Stalwarts, Investor Class (GGSOX) | -6.92% | -6.92% | -8.15% | -8.34% | 6.76% | n/a | 6.26% | |
| MSCI ACWI Mid Cap IndexVII | 0.17% | 0.17% | 4.00% | 3.69% | 13.95% | n/a | 8.32% | |
| MSCI ACWI Small Cap Index | -3.86% | -3.86% | -0.04% | 2.06% | 14.21% | n/a | 8.01% | |
| Morningstar Category Average: Global Small/Mid Stock | -3.57% | -3.57% | -2.64% | -2.49% | 10.87% | n/a | n/a | |
| Intl Opportunities, Institutional Class (GPIIX) | -3.57% | -3.57% | -10.11% | -8.48% | 6.44% | 4.01% | 7.52% | |
| Intl Opportunities, Investor Class (GPIOX) | -3.61% | -3.61% | -10.25% | -8.72% | 6.21% | 3.80% | 7.28% | |
| MSCI ACWI ex USA Small Cap Index | 0.76% | 0.76% | 2.38% | 1.50% | 12.35% | 5.76% | 6.68% | |
| Morningstar Category Average:Foreign Small/Mid Growth | 0.14% | 0.14% | -0.41% | -1.44% | 8.24% | 4.63% | n/a | |
| Intl Stalwarts, Institutional Class (GISYX) | -4.50% | -4.50% | -10.28% | -8.48% | 6.71% | n/a | 6.38% | |
| Intl Stalwarts, Investor Class (GISOX) | -4.60% | -4.60% | -10.50% | -8.71% | 6.44% | n/a | 6.12% | |
| MSCI ACWI ex USA Mid Cap IndexVIII | 4.42% | 4.42% | 5.75% | 3.33% | 11.12% | n/a | 6.11% | |
| MSCI ACWI ex USA Small Cap Index | 0.76% | 0.76% | 2.38% | 1.50% | 12.35% | n/a | 6.60% | |
| Morningstar Category Average: Foreign Small/Mid Growth | 0.14% | 0.14% | -0.41% | -1.44% | 8.24% | n/a | n/a | |
| EM Opportunities, Institutional Class (GPEIX) | -3.14% | -3.14% | -9.43% | -5.62% | 6.82% | 3.09% | 3.58% | |
| EM Opportunities, Investor Class (GPEOX) | -3.18% | -3.18% | -9.67% | -5.85% | 6.59% | 2.85% | 3.34% | |
| MSCI Emerging Markets SMID Cap IndexIX | -1.24% | -1.24% | 1.75% | 2.01% | 13.79% | 4.36% | 4.25% | |
| Morningstar Category Average: Diversified Emerging MarketsX | 1.77% | 1.77% | 4.96% | 1.72% | 8.84% | 3.59% | n/a | |
| US Stalwarts, Institutional Class (GUSYX) | -10.95% | -10.95% | -6.91% | -3.99% | 10.74 | n/a | 12.96% | |
| MSCI USA Mid Cap IndexXI | -3.31% | -3.31% | 2.34% | 3.92% | 16.69 | n/a | 18.58% | |
| MSCI USA Small Cap IndexXII | -7.75% | -7.75% | -2.19% | 2.53% | 15.69 | n/a | 17.98% | |
| Morningstar Category Average: Mid-Cap GrowthXIII | -8.18% | -8.18% | -2.39% | 1.71% | 12.37 | n/a | n/a | |
An investor should consider investment objectives, risks, charges, and expenses carefully before investing. To obtain a Grandeur Peak Funds prospectus, containing this and other information, visit www.grandeurpeakglobal.com or call 1-855-377-PEAK (7325). Please read it carefully before investing.
The performance data quoted represents past performance. Current performance may be lower or higher than the data quoted above. Past performance is no guarantee of future results. The investment return and principal value of an investment will fluctuate so that investor’s shares, when redeemed, may be worth more or less than their original cost. For performance information current to the most recent month-end, please call 1-855-377-PEAK (7325).
The Advisor may absorb certain Fund expenses, without which the total return would have been lower. Net Expense Ratio reflects the expense waiver, if any, contractually agreed to through September 1, 2025. A 2% redemption fee will be deducted on fund shares held 60 days or less. Performance data does not reflect this redemption fee or taxes.
| TOTAL EXPENSE RATIOS & INCEPTION DATES | |||||||||
| Inception Date | INVESTOR | INSTITUTIONAL | |||||||
| Fund | Gross | Net | Gross | Net | |||||
| Global Contrarian (GPGCX) | 09/17/2019 | 1.35% | 1.35% | ||||||
| Global Explorer (GPGEX) | 12/16/2021 | 3.14% | 1.25% | ||||||
| Global Micro Cap (GPMCX) | 10/20/2015 | 2.01% | 2.00% | ||||||
| Global Opportunities (GPGOX/GPGIX) | 10/17/2011 | 1.63% | 1.58% | 1.38% | 1.33% | ||||
| Global Reach (GPROX/GPRIX) | 06/19/2013 | 1.50% | 1.50% | 1.25% | 1.25% | ||||
| Global Stalwarts (GGSOX/GGSYX) | 09/01/2015 | 1.27% | 1.27% | 1.03% | 1.03% | ||||
| International Opportunities (GPIOX/GPIIX) | 10/17/2011 | 1.64% | 1.61% | 1.39% | 1.36% | ||||
| International Stalwarts (GISOX/GISYX) | 09/01/2015 | 1.17% | 1.17% | 0.92% | 0.92% | ||||
| Emerging Markets (GEPOX/GPEIX) | 12/16/2013 | 1.83% | 1.81% | 1.58% | 1.56% | ||||
| US Stalwarts (GUSYX) | 03/19/2020 | 0.90% | 0.90% | ||||||
There is no assurance that these opinions or forecasts will come to pass, and past performance is no assurance of future results.
RISKS: Investing in small and micro-cap funds will be more volatile and loss of principal could be greater than investing in large cap or more diversified funds. Investing in foreign securities entails special risks, such as currency fluctuations and political uncertainties, which are described in more detail in the prospectus. Investments in emerging markets are subject to the same risks as other foreign securities and may be subject to greater risks than investments in foreign countries with more established economies and securities markets. Diversification does not eliminate the risk of experiencing investment loss.
A Fund’s direct or indirect investments in foreign securities, including depositary receipts, involve risks not associated with investing in U.S. securities that can adversely affect the Fund’s performance. Foreign markets, particularly emerging markets, may be less liquid, more volatile, and subject to less government supervision than domestic markets.
The adviser’s judgments about the growth, value or potential appreciation of an investment may prove to be incorrect or fail to have the intended results, which could adversely impact the Fund’s performance and cause it to underperform relative to other funds with similar investment goals or relative to its benchmark, or not to achieve its investment goal.
[1] A Price-Earnings multiple is a measure of relative valuation and is calculated by taking a stock’s price or current market value divided by its earnings per share over the last 12 months.
[2] Factset, S&P500 Index, 3/31/2025
[3] Factset, S&P500 Index vs MSCI ACWI non-US IMI, 1/1/2022–12/31/2024, and 1/1/2020–12/31/2024
[4] Factset, MSCI US Large Cap Growth Index vs MSCI US Large Cap Value Index, 1/1/2022-12/31/2024, and 1/1/2020 –12/31/2024
[5] MSCI ACWI World ex USA IMI versus MSCI USA Large Cap Index, 1/1/2025-3/31/2025.
[6] MSCI USA Large Cap Growth Index, 1/1/2025-3/31/2025.
[7] Warren Buffett, 1998 Berkshire Hathaway Annual Meeting discussion.
[8] Morningstar Direct, Calendar Year Returns by Quality Quintile, 2006-1Q2025.
[9] Grandeur Peak Global Advisors – About Us – Global Footprint, https://grandeurpeakglobal.com/global-footprint/
[10] “Cost of Electricity by Country,” 2025, https://worldpopulationreview.com/country-rankings/cost-of-electricity-by-country
[11] “Gas and electricity prices during the ‘energy crisis’ and beyond,” 2025, https://commonslibrary.parliament.uk/research-briefings/cbp-9714/
[12] Alternative Investment Market (AIM) is a sub-market of the London Stock Exchange, composed of smaller, high-growth companies, with more flexible reporting and regulatory requirements.
[13] The Financial Times Stock Exchange 250 (FTSE 250 Index) is an index comprised of mid-cap, blue chip companies, ranked 101 to 350, listed on the London Stock Exchange (LSE).
[14] The Russell 2000 is an index of 2000 US, small-cap companies
[15] A P/E ratio is the comparison of a stock’s price or current market value to its earnings per share over the last 12 months and can be used as a measure of relative valuation.
[16] “Who will benefit most from a new UK-US trade deal?”, 2025, https://www.the-independent.com/news/uk/politics/trade-deal-us-uk-tariffs-trump-starmer-b2733495.html
[17] Investment Adviser Public Disclosure database, https://adviserinfo.sec.gov/firm/summary/158270
[I] The MSCI ACWI Small Cap Index is designed to measure the equity market performance of small-cap companies across developed emerging markets globally.
[II] The MSCI ACWI ex USA Small Cap Index is designed to measure the equity market performance of small cap companies across developed and emerging markets globally, excluding the United States.
[III] Morningstar Foreign Small/Mid Value portfolios invest in international stocks that are smaller and less expensive than other stocks. These portfolios primarily invest in stocks that fall in the bottom 30% of each economically integrated market (such as Europe or Asia ex-Japan). Value is defined based on low valuations (low price ratios and high dividend yields) and slow growth (low growth rates for earnings, sales, book value, and cash flow). These portfolios typically will have less than 20% of assets invested in U.S. stocks.
[IV] Morningstar Global Small/Mid Stock portfolios invest in international stocks that are smaller, growing faster, and higher-priced than other stocks. These portfolios primarily invest in stocks that fall in the bottom 30% of each economically integrated market (such as Europe or Asia ex-Japan). Growth is defined based on fast growth (high growth rates for earnings, sales, book value, and cash flow) and high valuations (high price ratios and low dividend yields). These portfolios typically will have less than 20% of assets invested in U.S. stocks.
[V] The MSCI World Micro Cap Index is designed to measure the equity market performance of micro-cap companies across developed markets globally. It does not include emerging markets.
The MSCI ACWI ex USA Mid Cap Index is designed to measure the equity market performance of mid cap companies across developed and emerging markets globally, excluding the United States.
[VI] Morningstar Foreign Small/Mid-Growth portfolios invest in international stocks that are smaller, growing faster, and higher-priced than other stocks. These portfolios primarily invest in stocks that fall in the bottom 30% of each economically integrated market (such as Europe or Asia ex-Japan). Growth is defined based on fast growth (high growth rates for earnings, sales, book value, and cash flow) and high valuations (high price ratios and low dividend yields). These portfolios typically will have less than 20% of assets invested in U.S. stocks.
[VII] The MSCI ACWI Mid Cap Index is designed to measure the equity market performance of mid-cap companies across developed and emerging markets globally.
[VIII] The MSCI ACWI ex USA Mid Cap Index is designed to measure the equity market performance of mid cap companies across developed and emerging markets globally, excluding the United States.
[IX] The MSCI Emerging Markets SMID Cap Index is designed to measure the equity market performance of small and mid-cap companies across emerging markets.
[X] Morningstar Diversified Emerging Markets portfolios tend to divide their assets among 20 or more nations, although they tend to focus on the emerging markets of Asia and Latin America rather than on those of the Middle East, Africa, or Europe. These portfolios invest predominantly in emerging market equities, but some funds also invest in both equities and fixed income investments from emerging markets.
[XI] The MSCI USA Mid-Cap Index is designed to measure the performance of the mid-cap segments of the US market. With 340 constituents, the index covers approximately 15 percent of the free float-adjusted market capitalization in the US.
[XII] The MSCI USA Small Cap Index is designed to measure the performance of the small-cap segment of the US equity market. With 1,781 constituents, the index represents approximately 14 percent of the free float-adjusted market capitalization in the US. MSCI makes no express or implied warranties or representations and shall have no liability whatsoever with respect to any MSCI data contained herein. The MSCI data may not be further redistributed or used to create indices or financial products. You cannot invest directly in any index.
[XIII] Morningstar Mid-Cap Growth portfolios invest in stocks of all sizes, thus leading to a mid-cap profile, but others focus on midsize companies. Mid-cap growth portfolios target U.S. firms that are projected to grow faster than other mid-cap stocks, therefore commanding relatively higher prices. Stocks in the middle 20% of the capitalization of the U.S. equity market are defined as mid-cap. Growth is defined based on fast growth (high growth rates for earnings, sales, book value, and cash flow) and high valuations (high price ratios and low dividend yields).