
Contents
Market Commentary
Portfolio Commentary
Notes from the Road
Business Update
Total Returns | As of March 31, 2024
Market Commentary
Key Takeaways
- After ending 2023 with a strong rally, global small cap stocks have been stuck in stall speed thus far in 2024.
- While large cap equities have outperformed, they continue to be driven largely by mega cap stock performance.
- The stock-bond correlation[1] has been elevated in global small cap markets over the past three years, especially for foreign small cap growth stocks.
- We believe the high stock-bond correlation within small cap markets may explain the extended breakdown in the price-earnings relationship.
- While our relative performance has lagged over the past three years, the underlying fundamentals of our portfolio companies are sound, and we believe valuations will recover.
Stall Speed
Following 2022, when investors endured a broad-based equity market sell-off, the global small cap market spent the first ten months of 2023 struggling to find its footing, returning -1.46% during the period[2]. Then, in the last two months of the year, increased expectations for more accommodative monetary policies (i.e., lower interest rates) prompted risk appetites to improve and equity markets to rally. Global small cap equities delivered +19.16% in that 2-month period[3], returning +17.41% for the year. Yet, as we began 2024, expectations for lower rates during the year tempered significantly, causing small cap markets to move into stall speed mode. As a result, global small caps have delivered a lackluster +2.55% through the first half.[4]
In contrast, global large cap markets have returned a strong +11.58% during the first half of 2024.[5] While large cap markets clearly have had the upper hand, it is important to recognize that they continue to be propelled by US large caps. The S&P 500[6] delivered +15.29% in the first half of 2024. Furthermore, a select group of US mega cap stocks, known to many as the “Magnificent Seven[7]” or Mag Seven for short, explain much of the strong performance. In 2023, the Mag Seven stock performance represented 62% of the S&P 500 +26.28% return. Remarkably, through the first half of 2024, the Mag Seven performance has also accounted for 62% of the S&P 500 return. As a result, the S&P 500 Market Cap-Weighted index[8] has outperformed the S&P 500 Equal-Weight Index[9] by 25.94% in the last 18 monthsx[10]. This level of outperformance by the S&P 500 Market Cap-Weighted index has not been observed between the two indices since the late 1990’s. In addition, as a result of the strong mega cap performance, the ten largest stocks in the Market Cap-Weighted index now account for over 36% of the index’s overall value, which is a record high (see illustration below).
Exhibit 1
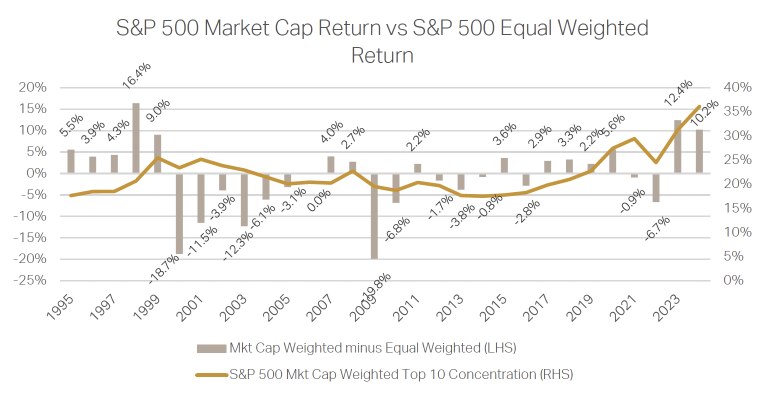
Source: FactSet, June 2024
Without the contribution by the Mag Seven, the S&P 500 return was +5.86% for the year through the end of June[11], which is much closer to what has been realized across other segments of the global equity market. So, while in aggregate, large cap markets are outperforming, when you exclude the Mag Seven and a few other large cap highfliers, the vast majority of the large cap market is only modestly outperforming lower cap markets.
Why are small cap markets in stall speed? While there may be several reasons, we believe the primary driver is the current interest rate environment. Over time, equity markets have had a very inconsistent relationship with interest rates, as the 1-year rolling stock-bond correlation[12] chart illustrates below.
Exhibit 2
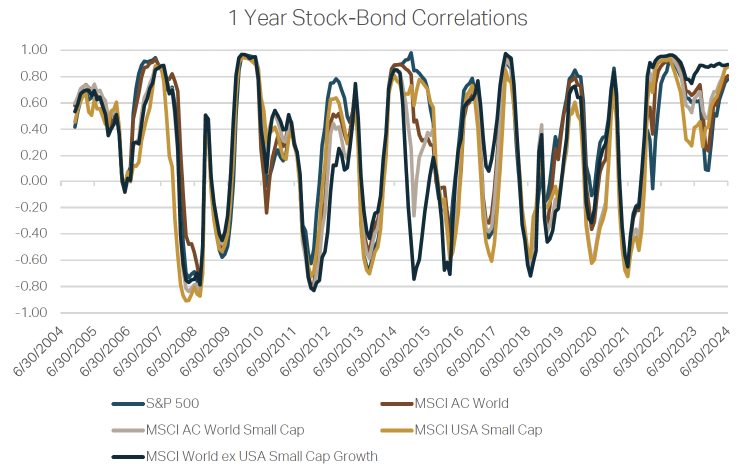
Source: FactSet, June 2024
The equity market realized a spike in the stock-bond correlation during 2022 as monetary policy makers aggressively increased interest rates to stomp out Covid-era inflationary pressures. As interest rates leveled out, the stock-bond correlation reverted in many broad market indices. The exception was in global small cap markets, where the correlation has remained elevated. This is especially the case for foreign small cap growth stocks. In recent months, the stock-bond correlation has increased significantly for many equity markets, as collective investor sentiment again appears to be heavily dictated by the future path of interest rates.
It is easier to appreciate the abnormally high stock-bond correlation exhibited in global small cap stocks by comparing it to other segments of the equity market over longer periods. Exhibit 3 below illustrates the rolling 3-year correlation across broad market indices. Note that the correlation for small cap markets has been meaningfully higher than large cap markets. Furthermore, the correlation for foreign small cap growth stocks has been close to 1 (i.e., almost perfectly correlated) for the past three years.
Exhibit 3
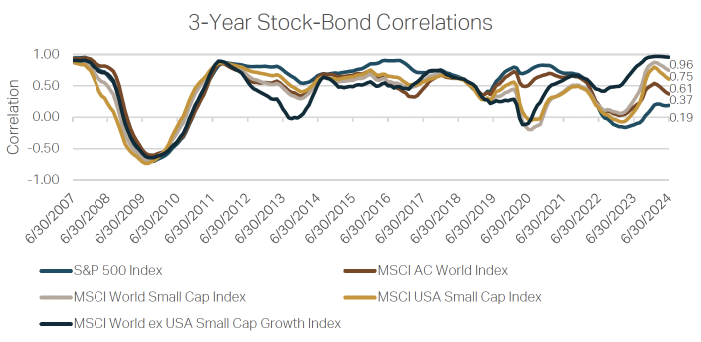
Source: FactSet, June 2024
We believe the unusually strong relationship between global small cap stocks and interest rates may explain the abnormally low relationship between stock prices and earnings. While the correlation between price and earnings has been lower than average for most equity markets over the past three years, the breakdown has been especially pronounced for global small caps as illustrated below.
Exhibit 4
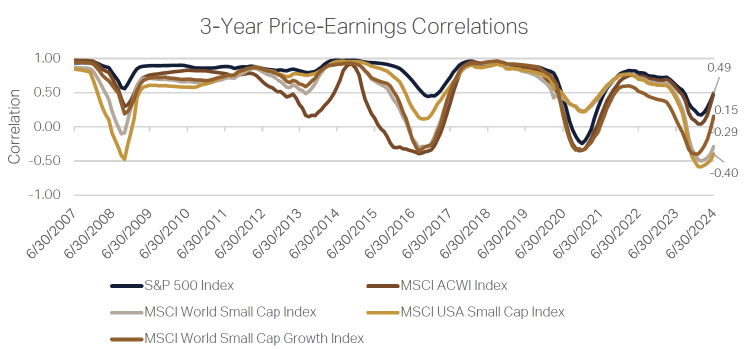
Source: FactSet, June 2024
While many factors may impact portfolio performance over time, we believe the consistently high correlation that small cap growth stocks have had with interest rates and the breakdown in the price-earnings relationship have been primary contributors to our absolute and relative performance struggles. This has required us to exercise an unusual amount of patience and investment discipline. We acknowledge that it has also required you, our clients, to do the same, for which we are grateful.
Please be assured that we remain committed to our primary objective, which is to produce long-term growth of capital. That requires that we focus on generating captured earnings growth, which dictates the long-term price performance of public equity markets (see Exhibit 5). The strength in the long-term stock price-earnings relationship serves as our north star and guides of through large and extended periods of market dislocation.
Exhibit 5
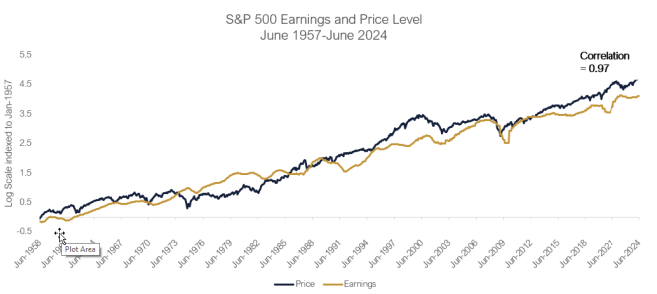
Source: FactSet, June 2024
We are confident that as we remain disciplined and patient, we can produce attractive long-term earnings growth, which may result in potentially strong long-term performance results.
Impair versus repair
Whenever an asset is subject to a significant price decline, investors must determine if it has been impaired or if the decline is due to a temporary price dislocation. Impaired assets, defined as those permanently broken, are usually written down or, in some cases, written off completely. In other cases, they are sold to other investors at a steep discount. Even the most skilled investors can be subject to cases where they must impair an asset at some point during their investment career. However, they also know that very attractive investment returns can be generated from buying assets that trade at a steep discount to their fundamental value. Regardless, there are many cases where investors prematurely conclude that an asset is impaired when, in fact, it is “repairable.” In public equity markets, investors can easily impair a stock by simply liquidating the position, thus ensuring a loss. The same is true for mutual fund investors, who can quickly impair an entire portfolio of stocks with the push of a button.
Over the past three years, an unusually high number of stocks in the global small cap market, even entire regions, and industries, have experienced significant price declines. It has been driven by investors who would prefer to impair now rather than wait for the repair. Temporary and even extended market dislocations may happen for a number of reasons. In some cases, they may be triggered by macro-economic factors such as geopolitical risk, interest rate cycles or a significant reduction in risk taking appetites. In other cases, they may be the result of idiosyncratic factors such as falling short of earnings guidance after years of beating forecasts, new disruptive technologies, or other company specific events. In the past three years, we believe a confluence of factors has disrupted markets and frustrated fundamentals investors.
Yet, in many cases, our research team, after performing extensive on the ground due diligence, has concluded that there are many stocks where nothing is fundamentally broken and that the signs of strong earnings growth potential remain intact. In other words, we have found many stocks which have been subject to mistaken impairment. While we may not be able to control or accurately forecast when these stocks may recover, we believe in their long-term earnings growth potential, and that they eventually will recover.
Shelby Cullom Davis, a well-known mid-20th century investor once said, “You make most of your money in a bear market, you just don’t realize it at the time.”[13] We believe Davis was right. While it can be challenging to remain optimistic after experiencing the last three years of market gyrations, we are confident in our investment process and the portfolio companies we own. We are excited about the potential stored value we believe our portfolios currently hold. We trust that when market valuations recouple with fundamentals within small cap markets, our portfolios are positioned to deliver very attractive results.
Portfolio Commentary
QUARTERLY PERFORMANCE KEY TAKEAWAYS
- While most of our portfolios did not have strong relative performance during the quarter, the primary detractors were the result of short-term technical headwinds and not material allocation or selection mistakes.
- Most of the strong Q2 performers in the index were what we believe to be lower quality stocks that are not typical candidates for Grandeur Peak portfolios.
- The Technology sector outperformed during the quarter, which was favorable for performance in most funds given an overweight to the sector.
- Our Health Care exposure was a detractor from performance. While we own high quality names at attractive valuations, business momentum continues to be slow in the industry, delaying what we believe is an inevitable recovery.
- Performance within Financials was mixed in Q2. However, weighting was favorable given our top names outperformed.
- Our positioning within Industrials was also a headwind for performance, especially in the US, given a slowdown in momentum. However, we are beginning to see signs of a reversal in this trend, mainly in Europe, which will be favorable for our portfolios as we look forward.
- Our portfolio companies continue to maintain strong fundamentals as we remain focused on delivering attractive captured earnings growth.
- As markets stabilize and fundamentals regain traction, we believe our portfolios have the potential to deliver attractive investment returns.
Last quarter we highlighted four larger positions that were significant detractors in the first three months of the year. One of the four was subject to a quality score downgrade and we lowered its portfolio weight as a result. We believed the other three were experiencing shorter-term bumps in the road that would pass. In Q2, we were pleased to see the return of those three names average +14.93%.
More broadly, despite a good earnings season in Q2 and the relatively strong Quality-Value-Momentum (QVM) positioning of our portfolios, we struggled to keep up with the benchmark (i.e., fund performance was in-line with or trailed the index, depending on the fund). In an effort to identify the sources of underperformance, we went through every stock in the benchmark that was up +15% or more. We discovered that the big winners for the quarter were 1) poor quality 2) India stocks, where multiples continue to skyrocket 3) questionable Chinese names 4) perceived artificial intelligence (AI) beneficiaries, and/or 5) a handful of good companies with strong business momentum. In sum, many of the stocks that outperformed during the quarter were the result of trend following and speculation, not strong fundamental results.
Fundamentally, while most of the market realized a slowdown in business momentum in 2023 and in early 2024, we expect momentum to improve fairly meaningfully for a good portion of our portfolio over the next couple of quarters. Regardless, the captured earnings growth across our funds continues to exceed that of the index. Below we have illustrated the Grandeur Peak Global Reach Fund (GPRIX) captured earnings growth over time relative to its benchmark, the MSCI AC World Small Cap Index, since 2017. The Global Reach Fund is one of our longer list portfolios, which we believe is a good proxy for the whole of what we own.
Exhibit 6
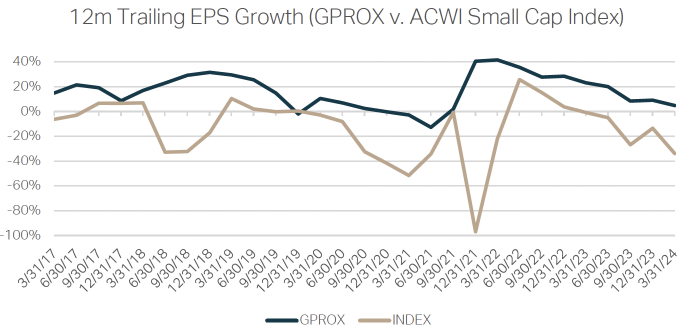
Source: Refinitiv, Grandeur Peak, March 30, 2024
In Consumer, it is easiest to breakdown our exposure geographically given differences in our current outlook across regions. In the US, the data continues to tell us that US consumers are cautious and seem more vulnerable than consumers in other areas throughout the world, so we remain conservatively positioned. Approximately half of what we own in the sector is defensive in nature (discount retail, consumer staple, etc.). The other half of our Consumer weight is in Discretionary names concentrated in what we believe are great valuations, great brands/businesses, but with slower near-term momentum.
Outside of the US, we are increasingly excited about exposure to SE Asia. We are finding what we believe are companies with high quality, attractive valuation, and positive momentum, thanks in part to trend of diversification away from China.
Consumer stocks in Japan are challenging due to an aging demographic. We would like to own more but are being cautious. We refuse to match the weight of the index just for the sake of having the exposure.
We feel excited about the Consumer portfolio we have assembled. We think most of the detractors in Q2 were the market acting irrationally, giving us great buying opportunities.
Within Financials, the strongest performance in Q2 came from US Capital Markets Advisors. All of our US advisors contributed positively during the quarter. We added weight to Advisors about a year ago at what felt like a cyclical low. Stocks are up since then on future expectations (shareholders are now paying for a couple of years of future strong earnings growth). We have been trimming as more performance continues to be pulled forward as we have yet to see earnings rebound meaningfully. It remains a favorite theme, but we have shifted more weight by taking profits in higher valuation names and moving to what we believe are better valuation names.
Our other preferred area of Financials exposure is Asset Managers. Within this sub-sector, we are finding what we believe to be remarkable quality and valuation, but we continue to wait for business momentum to return. Particularly within Private Equity, where the market is deep into a waiting game. Managers are waiting to transact, hoping that prices will improve in coming months if rates dip. Investors are waiting for their capital to be returned and are showing hesitancy to continue committing new capital as dry powder is at extreme highs.
We have fortunately had exposure to a few public market and private credit managers who have had strong momentum in addition to good quality and valuation. Stock price rallies in these names have led us to trim exposure. We have also been engaging with a handful of our companies on strategy and governance.
Emerging Market Financials were tough for us in Q2. The geopolitical risks associated with Latin America continue to be a main challenge in the region. In Mexico, newly appointed President Sheinbaum and the Morena party won by a landslide, which caused a big market reaction which was negative for our banking and real estate exposure. However, post-election, we are seeing some very pro-business cabinet appointments and signaling that taxes will not be raised. The knee-jerk worry that the new president would damage the near-shoring trend seems to be overblown. As valuations still have not fully recovered, we have had opportunities to increase our exposure within Financials and other sectors.
While our overall Financials performance was mixed in Q2, weighting was in our favor in the quarter. Our top names outperformed the rest of the tranche on a return and contribution basis.
Within Technology, the AI theme remain largely in focus and continues to drive markets, as seen in the continued incredible stock price performance of Nvidia[14]. However, we are starting to hear contrarian voices more frequently asking if there will be an attractive return on investment for all of this capital flooding into the theme. We are also hearing that alternatives to Nvidia and their suppliers are getting closer and closer to market. We believe there is a scenario where many companies which have been on fire for the last year could be down significantly as anticipated returns are not realized. We urge investors to remember the John Templeton maxims, including, “Invest for Real Returns,” “Never Follow the Crowd,” “Buy During Times of Pessimism,” and “Hunt for Value and Bargains”[15] .
We were overweight Technology in all strategies and outperformed in most. Given the current AI trend, Semiconductor, Equipment, and Tech Hardware sub sectors were strong areas of the market in Q2. We were fortunately able to outperform in these sectors across most of our strategies. Some of our names are reaching valuations that are causing us to trim, while other still sit nicely within our QVM Framework.
Software in general has struggled lately, as companies are delaying investments. Even in cyber security, which we view as critical, there is increasing talk of spending fatigue. Our exposure mostly outperformed as we have avoided the more cyclical Application Software and prefer investing in Infrastructure Software. We also had two takeouts in our Software & Services exposure that were a boost to quarterly performance.
In US Industrials we have seen an increase in companies missing earnings expectations and lowering future earnings estimates. After a strong 2023, companies now face tough year-over-year comparables. Conversely, Europe struggled last year, and now has improving PMIs[16] , momentum, and easy comparables.
There has been little change in our Industrials positioning. We underperformed in the quarter across most funds, but as we look company by company, the main detractions were due to short-term headwinds as opposed to thesis impairing changes. Our equipment rental exposure was a drag on performance as the US megaprojects have not yet ramped up as expected. Some of our US human resource technology names have sold off some on moderating data from the US labor market. Northern European compounders had strong performance, forcing us to trim as expected returns compress. India is firing on all cylinders. The move away from China has greatly benefited India. Japanese professional services have good momentum, as companies providing services to the aging population are having plenty of success.
We experienced another tough quarter of performance within Health Care. While our exposure is concentrated in high quality names with attractive valuations, the business momentum has slowed. Regardless, we are willing to sacrifice uncertainty over the coming months with the anticipation that momentum will accelerate over a longer timeframe.
In Q2 we were overweight the worst performing sub-sector in Health Care, Life Sciences tools, and underweight the best performing sub-sector, Biotechnology.
Health Care has been one of the most underperforming sectors in the index over the last two years and we wonder if that will revert to the mean as biotechnology funding returns and clarity around the scope of the GLP-1 market emerges. Our Health Care weight has come down a bit over the past year due to takeouts in Animal Health. We will look to restore that weight when we find names that meet our quality and valuation standards and begin to see a turn in momentum for the sector.
Notes from the Road
Company Touch Tracker
This quarter our team engaged with 461 companies across the world, putting our trailing 12-month company touches at 1,609.
This past quarter, team members traveled domestically to New York, South Carolina, Wisconsin, Illinois, Georgia, California, Michigan, Maryland, Ohio, Washington DC, Colorado, Pennsylvania, and Texas. Internationally, team members traveled to Japan, Sweden, London, Canada, United Kingdom, Belgium, SE Asia, and Switzerland.
SouthEast Asia Recap
Tyler Glauser, Research Analyst and Portfolio Manager of the Global Reach Fund, Joseph Nydegger, Research Analyst, Matt Kaelberer, Research Analyst, and Amy Johnson, Senior Manager, Client Relations, spent two weeks in Southeast Asia. Here are some of their thoughts on the trip:
We did 40 meetings across six countries in two weeks. Indonesia, Malaysia, Singapore, Thailand, Vietnam, and the Philippines. Despite the grind of the journey, as usual, it was a pleasure to see the world a bit, taste the food, meet people, and gain a better understanding of the nuances of the culture in each place.
China was a major topic of conversation on this trip. The impact of China and the trade concerns on the economies throughout Southeast Asia cannot be overstated. In Indonesia, brand distribution companies are recruiting Chinese manufacturers to set up capacity in Indonesia through joint investments. The hope is to nearshore manufacturing capacity and scale Chinese expertise across Indonesia. Current regulations in Indonesia include anti-dumping laws as protection against the Chinese manufacturers which are searching for locations to fill their excess capacity in the face of current and potentially increasing tariffs with the United States. Setting up domestic capacity can solve a problem for both parties. Another interesting observation in Indonesia is that the mom-and-pop retailers in a variety of industries have continued to do relatively well. It is difficult to scale a retail operation across a vast archipelago, and most of the multinational corporations have struggled to scale outside of the main Java Island.
It is interesting to contemplate the impact of the wars in distant parts of the world on SE Asia. Indonesia is a majority Muslim country and there have been boycotts on Starbucks over the US support of Israel in the conflict with Palestine. Interestingly, Skechers, which is operated by the same Indonesia company as Starbucks, has not been boycotted. People LOVE their Skechers. Other ripple effects of war are noteworthy as well, creating opportunities for companies in the region.
The Indonesian economy has had a strange couple of years. The lowest income consumers have been under intense pressure, but with an election year last year the pressure was masked by cash being injected into the market by the government. Now, as the payments from the government have stopped for a time, we believe the cracks in the economy have shown through a bit more. Things remain reasonably good for the middle- and upper-income consumers, who are disproportionately found in Jakarta and the surrounding areas. I loved Jakarta and with the new metropolitan subway system, it was much easier to get around than the last time I traveled there in 2022. It is amazing to see such a transformation in just a couple of years.
Our next stop was Malaysia. It was my first time visiting and my first observation was how similar it felt to Singapore. It was interesting to hear from some companies about the Semiconductor investments from China rippling through the region. China’s quest for semiconductor independence from the US has moved in parallel to the US’ quest for semiconductor independence from China.
My first return to Singapore since my time there in business school in 2020-21 was bittersweet. First, we stayed in the same hotel that I had quarantined in for 15 days when I first arrived there in 2020. After wrapping our first week of meetings, we finally had a minute to enjoy our surroundings. We rented bikes and rode around Marina Bay, seeing some of the gardens, and all the beautiful buildings and unique architecture. The meetings in Singapore were interesting as well. We had a fascinating discussion with the heiress to a major retail operation. She said it is essentially a one-party democracy where the state controls all the media, sets regulations for everything, and the same people have been in power since the country’s inception. She explained how the government is developing all the residential areas, awarding a lease to one grocer and one baker and one barber, etc. in each area. From a Western, capitalist perspective, the master planning model may seem complex, but for the government of Singapore, it is one tool to potentially control development goals beyond only financial investment factors.
Joe Nydegger and I spent the weekend in Thailand. Thailand is a beautiful place. The meetings were quite good with a few more actionable ideas. We were struck by how inexpensive everything was. With the Thai Baht down around 20% in the last couple of years, our meals and snacks felt like great values. It is interesting to consider how well some of the businesses we met with have done over the last several years. They have been impacted by COVID, the death of their king, and a coup. Many of these businesses are trading for remarkably low valuations, and that is compounded further by the recent weakness of the currency.
Our next stop was in Vietnam. Communism is very apparent in Vietnam. In some ways things are physically so clean, organized, and efficient, yet simultaneously there are such obvious inefficiencies. So much bureaucracy and red tape. So many rules about things that would be considered inconsequential in the West. We were also reminded once more on how important it is to understand the unique cultures around the world as a global investor. If an investment thesis hinges on dairy consumption per capita increasing and converging towards the levels of other places, it is important to note how culturally different dairy consumption is viewed and explore reasons why things might not converge with the West, or even other Asian countries. The influence of government cannot be overstated, here as in most emerging countries, in particular those with communist governments.
Finally, as we spent time in the Philippines, which felt like the most lacking emerging economy of the countries we visited. Traffic in Manila was horrible. The city felt dirty and chaotic. Maybe it was simply a function of where we stayed. We believe the country, however, feels like it has found a sweet spot of GDP[17] growth. The current levels are low, but the people are entrepreneurial and hard-working. Seems likely that we could have a good run from the Philippines in the coming years.
In all, we had some productive meetings on this trip and gleaned connected global dots across SE Asia and across multiple sectors that we hope can translate into some good stock picks for our funds.
Business Update
We are pleased to welcome Ray Pena, Software Engineer on the Quantitative Research team. Ray brings three years of experience to the firm and has been charged with developing software and tools to improve and automate processes. He previously worked as a Full Stack Software Engineer and has experience creating web applications in a variety of programming languages.
Preston Williams graduated with Dean’s Honors, earning an MBA from Columbia University. He has returned to full-time work with Grandeur and maintains his role on the Health Care team. He will maintain his residence in New York City. His insights and learnings from his education have already benefitted our team.
Cyrus Crockett graduated magna cum laude from Brigham Young University with a BA in Philosophy, and minors in Format Logic and Business. During his studies, Cyrus was a recipient of the Excellence in Philosophy Scholarship and had his work published in the undergraduate journal of philosophy, Aporia. He has worked as an intern at Grandeur since 2021and will continue to be a part of the Industrials and Energy & Materials teams as he moves to fulltime.
We are pleased to announce that Ayden Richards has recently earned his CFA®, becoming the 12th member of our team to become a CFA® charter holder. Ayden joined the firm in 2017 and was originally part of the Client Team before joining the Research team as an analyst in 2019. He is an important member of our team covering the United States.
As mentioned last quarter, we encourage and support our team in seeking further education by providing individual learning budgets and co-investment opportunities for graduate school programs.
Our firm assets held steady at approximately $5.9 billion in assets under management (AUM) this quarter.
As always, please feel free to reach out any time with any questions, requests, or comments. We appreciate the opportunity to work on your behalf.
Sincerely,
Todd Matheny, CAIA®
Jesse Pricer, CFA®
Amy Johnson, CFP®
The Grandeur Peak Client Team
Total Returns | As of June 30, 2024
| CUMULATIVE | ANNUALIZED | |||||||
| QTR | YTD | 1 YR | 3 YR | 5 YR | 10 YR | SINCE FUND INCEPTION | ||
| Global Contrarian, Institutional Class (GPGCX) | 1.17% | 3.60% | 15.84% | 3.38% | n/a | n/a | 12.58% | |
| MSCI ACWI Small Cap Index[i] | -1.41% | 2.55% | 11.16% | -0.28% | n/a | n/a | 8.05% | |
| MSCI ACWI Small Cap Value Index[ii] | -1.76% | 1.48% | 12.29% | 2.29% | n/a | n/a | 7.87% | |
| MSCI ACWI ex US Small Cap Index[iii] | 0.85% | 3.08% | 11.80% | -0.96% | n/a | n/a | 7.01% | |
| Global Explorer, Institutional Class (GPGEX) | -1.75% | -3.33% | 5.05% | n/a | n/a | n/a | -8.78% | |
| MSCI ACWI Small Cap Index | -1.41% | 2.55% | 11.16% | n/a | n/a | n/a | 0.75% | |
| MSCI ACWI IMI Index[iv] | 2.53% | 10.56% | 18.94% | n/a | n/a | n/a | 4.99% | |
| Global Micro Cap, Institutional Class (GPMCX) | -2.14% | -0.58% | 9.14% | -8.41% | 8.42% | n/a | 8.44% | |
| MSCI ACWI Small Cap Index | -1.41% | 2.55% | 11.16% | -0.28% | 7.79% | n/a | 8.19% | |
| MSCI World Micro Cap Index[v] | -2.61% | 0.00% | 5.07% | -6.90% | 5.32% | n/a | 6.34% | |
| MSCI ACWI ex -US Small Cap Index | 0.85% | 3.08% | 11.80% | -0.96% | 6.60% | n/a | 6.53% | |
| Global Opportunities, Investor Class (GPGOX) | -4.21% | -9.07% | -1.58% | -9.95% | 6.38% | 6.41% | 10.21% | |
| Global Opportunities, Institutional Class (GPGIX) | -4.11% | -9.09% | -1.54% | -9.75% | 6.62% | 6.64% | 10.49% | |
| MSCI ACWI Small Cap Index | -1.41% | 2.55% | 11.16% | -0.28% | 7.79% | 6.70% | 9.49% | |
| MSCI ACWI IMI Index | 2.53% | 10.56% | 18.94% | 5.20% | 10.88% | 8.71% | 10.62% | |
| Global Reach, Investor Class (GPROX) | -1.39% | -3.82% | 4.63% | -9.15% | 5.95% | 6.24% | 8.25% | |
| Global Reach, Institutional Class (GPRIX) | -1.25% | -3.65% | 4.96% | -8.91% | 6.20% | 6.49% | 8.51% | |
| MSCI ACWI Small Cap Index | -1.41% | 2.55% | 11.16% | -0.28% | 7.79% | 6.70% | 8.11% | |
| MSCI ACWI IMI Index | 2.53% | 10.56% | 18.94% | 5.20% | 10.88% | 8.71% | 9.74% | |
| Global Stalwarts, Investor Class (GGSOX) | -1.94% | -5.21% | 5.22% | -11.19% | 4.53% | n/a | 7.61% | |
| Global Stalwarts, Institutional Class (GGSYX) | -1.85% | -5.08% | 5.50% | -10.95% | 4.82% | n/a | 7.88% | |
| MSCI ACWI Mid Cap Index[vi] | -2.30% | 3.53% | 11.31% | 0.49% | 7.37% | n/a | 8.29% | |
| MSCI ACWI Small Cap Index | -1.41% | 2.55% | 11.16% | -0.28% | 7.79% | n/a | 8.55% | |
| Intl Opportunities, Investor Class (GPIOX) | -3.58% | -8.50% | -2.38% | -11.58% | 3.48% | 4.19% | 8.34% | |
| Intl Opportunities, Institutional Class (GPIIX) | -3.54% | -8.40% | -2.08% | -11.32% | 3.75% | 4.43% | 8.58% | |
| MSCI ACWI ex-US Small Cap Index | 0.85% | 3.08% | 11.80% | -0.96% | 6.60% | 4.86% | 6.96% | |
| MSCI ACWI ex-US IMI Index[vii] | 1.12% | 5.63% | 12.12% | 0.70% | 6.12% | 4.40% | 6.29% | |
| Intl Stalwarts, Investor Class (GISOX) | -2.26% | -6.23% | 2.01% | -10.55% | 4.96% | n/a | 7.73% | |
| Intl Stalwarts, Institutional Class (GISYX) | -2.18% | -6.07% | 2.33% | -10.30% | 5.24% | n/a | 7.99% | |
| MSCI ACWI ex-US Mid Cap Index[viii] | -0.44% | 2.34% | 10.03% | -1.35% | 4.67% | n/a | 5.91% | |
| MSCI ACWI ex-US Small Cap Index | 0.85% | 3.08% | 11.80% | -0.96% | 6.60% | n/a | 7.00% | |
| EM Opportunities, Investor Class (GPEOX) | -0.79% | -3.15% | 1.69% | -8.10% | 4.37% | 3.67% | 4.51% | |
| EM Opportunities, Institutional Class (GPEIX) | -0.70% | -2.96% | 1.97% | -7.87% | 4.62% | 3.90% | 4.75% | |
| MSCI Emerging Markets SMID Cap Index[ix] | 4.19% | 4.78% | 15.26% | 0.24% | 7.09% | 4.10% | 4.79% | |
| MSCI Emerging Markets IMI Index[x] | 5.25% | 7.61% | 14.00% | -3.70% | 4.34% | 3.48% | 4.06% | |
| US Stalwarts, Institutional Class (GUSYX) | -3.61% | -2.61% | 10.59% | -7.22% | n/a | n/a | 16.35% | |
| MSCI US Mid Cap Index[xi] | -3.89% | 4.66% | 12.53% | 2.15% | n/a | n/a | 20.40% | |
| MSCI US Small Cap Index [xii] | -3.45% | 2.03% | 10.51% | 0.27% | n/a | n/a | 21.08% | |
An investor should consider investment objectives, risks, charges, and expenses carefully before investing. To obtain a Grandeur Peak Funds prospectus, containing this and other information, visit www.grandeurpeakglobal.com or call 1-855-377-PEAK (7325). Please read it carefully before investing.
The performance data quoted represents past performance. Current performance may be lower or higher than the data quoted above. Past performance is no guarantee of future results. The investment return and principal value of an investment will fluctuate so that investor’s shares, when redeemed, may be worth more or less than their original cost. For performance information current to the most recent month-end, please call 1-855-377-PEAK (7325).
The Advisor may absorb certain Fund expenses, without which total return would have been lower. Net Expense Ratio reflect the expense waiver, if any, contractually agreed to through October 6, 2024. A 2% redemption fee will be deducted on fund shares held 60 days or less. Performance data does not reflect this redemption fee or taxes.
TOTAL EXPENSE RATIOS & INCEPTION DATES
| Inception Date | INVESTOR | INSTITUTIONAL | |||
| Fund | Gross | Net | Gross | Net | |
| Global Contrarian (GPGCX) | 09/17/2019 | 1.35% | 1.35% | ||
| Global Explorer (GPGEX) | 12/16/2021 | 3.45% | 1.25% | ||
| Global Micro Cap (GPMCX) | 10/20/2015 | 1.85% | 1.85% | ||
| Global Opportunities (GPGOX/GPGIX) | 10/17/2011 | 1.60% | 1.54% | 1.35% | 1.29% |
| Global Reach (GPROX/GPRIX) | 06/19/2013 | 1.50% | 1.50% | 1.25% | 1.25% |
| Global Stalwarts (GGSOX/GGSYX) | 09/01/2015 | 1.19% | 1.19% | 0.94% | 0.94% |
| International Opportunities (GPIOX/GPIIX) | 10/17/2011 | 1.60% | 1.55% | 1.35% | 1.30% |
| International Stalwarts (GISOX/GISYX) | 09/01/2015 | 1.13% | 1.13% | 0.88% | 0.88% |
| Emerging Markets (GEPOX/GPEIX) | 12/16/2013 | 1.75% | 1.72% | 1.50% | 1.47% |
| US Stalwarts (GUSYX) | 03/19/2020 | 0.90% | 0.90% | ||
There is no assurance that these opinions or forecasts will come to pass, and past performance is no assurance of future results.
RISKS: Investing in small and micro-cap funds will be more volatile and loss of principal could be greater than investing in large cap or more diversified funds. Investing in foreign securities entails special risks, such as currency fluctuations and political uncertainties, which are described in more detail in the prospectus. Investments in emerging markets are subject to the same risks as other foreign securities and may be subject to greater risks than investments in foreign countries with more established economies and securities markets. Diversification does not eliminate the risk of experiencing investment loss.
A Fund’s direct or indirect investments in foreign securities, including depositary receipts, involve risks not associated with investing in U.S. securities that can adversely affect the Fund’s performance. Foreign markets, particularly emerging markets, may be less liquid, more volatile, and subject to less government supervision than domestic markets.
The adviser’s judgments about the growth, value or potential appreciation of an investment may prove to be incorrect or fail to have the intended results, which could adversely impact the Fund’s performance and cause it to underperform relative to other funds with similar investment goals or relative to its benchmark, or not to achieve its investment goal.
[1] Correlation is a statistical measure that expresses the extent to which two variables are related. Correlation measures the strength in relations between two variables. A correlation of 1 indicates a perfect relationship, a correlation of -1 indicates a perfect inverse relationship. A correlation of 0 indicates no relationship.
[2] MSCI, Factset, Performance for the MSCI ACWI Small Cap Index, from January 1, 2023 to October 31, 2023.
[3] MSCI, Factset, Performance for the MSCI ACWI Small Cap Index, from November 1, 2023 to December 31, 2023.
[4] MSCI, Factset, Performance for the MSCI ACWI Small Cap Index, from January 1, 2024 to June 30, 2024.
[5] MSCI, Factset, Performance for the MSCI ACWI Index, from January 1, 2024 to June 30, 2024.
[6] The S&P 500 Index is a market cap-weighted index which includes the value of 500 corporations listed on the New York Stock Exchange and the NASDAQ. As a group, the Index is often considered a gauge of the strength of the US economy.
[7] The Magnificent Seven or Mag Seven refer to the top seven tech-related stocks in the S&P 500 Index: Apple, Google, Microsoft, Meta, Tesla, NVIDIA, and Amazon.
[8] See item 6 above.
[9] The S&P 500 Equal-Weight Index (EWI) is the equal-weight version of the widely used S&P 500 Market Cap-Weighted Index. The index includes the same constituents as the capitalization weighted S&P 500, but each company in the S&P 500 EWI is allocated a fixed weight – or 0.2% of the index total at each quarterly rebalance.
[10]Factset, January 1, 2023 to June 30, 2024
[11] Factset, January 1, 2024 to June 30, 2024
[12] The correlation is a statistical measure indicating the strength of the linear relationship between two quantitative variables. A correlation of +1 indicates a perfect positive relationship between two variables. A correlation of -1 indicates a perfect negative relationship between two variables. The rolling correlations are one-month observations of the trailing periodic correlation (e.g., 1-year, 3 year) over time.
[13] https://davisfunds.com/education/wisdom-quotes. A bear market is defined by a prolonged drop in investment prices.
[14] As of June 30, 2024, the Grandeur Peak Funds owned 0 shares in NVIDIA Corporation.
[15] https://www.franklintempletonme.com/insights/investor-education/templeton-maxims
[16] PMI is the Purchasing Managers’ Index, considered a measure of business conditions in the private manufacturing sector.
[17] GDP Growth is a measure of the gross domestic product of a country, measured by the value of final goods and services produced in a country over a given period.
[i] The MSCI ACWI Small Cap Index is designed to measure the equity market performance of small-cap companies across developed and emerging markets globally.
[ii] The MSCI ACWI Small Cap Value is designed to measure the equity market performance of small cap companies exhibiting overall value-style characteristics across developed and emerging markets globally.
[iii] The MSCI ACWI ex USA Small Cap is designed to measure the equity market performance of small cap companies across developed and emerging markets globally, excluding the United States.
[iv] The MSCI ACWI IMI Index is designed to measure the equity market performance of large, mid, and small-cap companies across developed and emerging markets globally.
[v] The MSCI World Micro Cap Index is designed to measure the equity market performance of micro-cap companies across developed markets globally. It does not include emerging markets.
[vi] The MSCI ACWI Mid Cap is designed to measure the equity market performance of mid-cap companies across developed and emerging markets globally.
[vii] The MSCI ACWI ex USA IMI is designed to measure the equity market performance of large, mid, and small cap companies across developed and emerging markets globally, excluding the United States
[viii] The MSCI ACWI ex USA Mid Cap is designed to measure the equity market performance of mid cap companies across developed and emerging markets globally, excluding the United States.
[ix] The MSCI Emerging Markets SMID Cap Index is designed to measure the equity market performance of small and mid-cap companies across emerging markets.
[x] The MSCI Emerging Markets IMI index is designed to measure the equity market performance of large, mid, and small-cap companies across emerging markets.
[xi] The MSCI US Mid-Cap Index is designed to measure the performance of the mid cap segments of the US market. With 340 constituents, the index covers approximately 15 percent of the free float-adjusted market capitalization in the US.
[xii] The MSCI US Small Cap Index is designed to measure the performance of the small cap segment of the US equity market. With 1,781 constituents, the index represents approximately 14 percent of the free float-adjusted market capitalization in the US.
| GLOBAL CONTRARIAN TOP 10 HOLDINGS As of 04/30/2024 | |
| % of Net Assets* | |
| Petershill Partners PLC | 4.7% |
| Riverstone Holdings, Ltd. | 4.3% |
| Plover Bay Tech | 3.5% |
| Beenos Inc | 2.7% |
| BayCurrent Consulting, Inc. | 2.7% |
| China Yongda Automobiles Services Holdings Limited | 2.1% |
| Chaoju Eye Care Holdings Ltd | 2.1% |
| Perella Weinberg Partners | 2.0% |
| Bank of N.T. Butterfield & Son Ltd. (The) | 2.0% |
| FPT Corp | 1.9% |
| Total | 28.0% |
| GLOBAL EXPLORER TOP 10 HOLDINGS As of 04/30/2024 | |
| % of Net Assets* | |
| Sporton International, Inc. | 1.1% |
| FPT Corp | 1.1% |
| JTC plc | 1.0% |
| B & M European Value Retail SA | 1.0% |
| Virbac SA | 1.0% |
| Volution Group PLC | 0.9% |
| Darktrace plc | 0.9% |
| BayCurrent Consulting, Inc. | 0.9% |
| Elastic N.V. | 0.8% |
| GQG Partners Inc | 0.8% |
| Total | 9.6% |
| GLOBAL MICRO CAP TOP 10 HOLDINGS As of 04/30/2024 | |
| % of Net Assets* | |
| Gulf Oil Lubricants India Ltd. | 2.7% |
| Pennant Group, Inc. (The) | 2.7% |
| Beenos Inc | 2.4% |
| Kogan.com Ltd | 2.4% |
| Fiducian Group Ltd | 2.4% |
| Swedencare AB | 2.3% |
| Barrett Business Services, Inc. | 2.1% |
| Sun* Inc | 1.9% |
| ULS Group Inc | 1.8% |
| Oro Co Ltd | 1.7% |
| Total | 22.5% |
| GLOBAL OPPORTUNITIES TOP 10 HOLDINGS As of 04/30/2024 | |
| % of Net Assets* | |
| B & M European Value Retail SA | 3.7% |
| Littelfuse, Inc. | 3.0% |
| Virbac SA | 2.5% |
| BayCurrent Consulting, Inc. | 1.7% |
| CVS Group plc | 1.6% |
| Melexis NV | 1.5% |
| Volution Group PLC | 1.5% |
| Vietnam Technological & Comm Joint-stock Bank | 1.4% |
| Qualys, Inc. | 1.3% |
| Silergy Corp | 1.3% |
| Total | 19.3% |
| GLOBAL REACH TOP 10 HOLDINGS As of 04/30/2024 | |
| % of Net Assets* | |
| B & M European Value Retail SA | 1.6% |
| BayCurrent Consulting, Inc. | 1.5% |
| Virbac SA | 1.2% |
| Darktrace plc | 1.1% |
| JTC plc | 1.1% |
| Silergy Corp | 0.9% |
| Ares Management Corporation | 0.8% |
| Sporton International, Inc. | 0.8% |
| Perella Weinberg Partners | 0.8% |
| Petershill Partners PLC | 0.8% |
| Total | 10.7% |
| GLOBAL STALWARTS TOP 10 HOLDINGS As of 04/30/2024 | |
| % of Net Assets* | |
| Littelfuse, Inc. | 3.5% |
| B & M European Value Retail SA | 3.2% |
| Silergy Corp | 2.9% |
| BayCurrent Consulting, Inc. | 2.5% |
| Pjt Partners, Inc. | 1.8% |
| Melexis NV | 1.7% |
| Virbac SA | 1.5% |
| Ashtead Group plc | 1.5% |
| Crowdshare Holdings, Inc. | 1.5% |
| Darktrace plc | 1.5% |
| Total | 21.5% |
| INTERNATIONAL OPPORTUNITIES TOP 10 HOLDINGS As of 04/30/2024 | |
| % of Net Assets* | |
| Volution Group PLC | 2.7% |
| B & M European Value Retail SA | 2.6% |
| Virbac SA | 2.2% |
| Silergy Corp | 2.0% |
| JTC plc | 1.9% |
| BayCurrent Consulting, Inc. | 1.8% |
| Sporton International, Inc. | 1.7% |
| Melexis NV | 1.5% |
| CVS Group plc | 1.5% |
| Integral Corp | 1.3% |
| Total | 19.1% |
| INTERNATIONAL STALWARTS TOP 10 HOLDINGS As of 04/30/2024 | |
| % of Net Assets* | |
| B & M European Value Retail SA | 4.5% |
| Silergy Corp | 3.0% |
| Darktrace plc | 2.9% |
| BayCurrent Consulting, Inc. | 2.7% |
| Melexis NV | 2.4% |
| JFrog Ltd. | 2.1% |
| Techtronic Industries Co Limited | 2.1% |
| Diploma plc | 1.9% |
| Monolithic Power Systems, Inc. | 1.9% |
| EQT AB | 1.9% |
| Total | 25.4% |
| EMERGING MARKETS OPPORTUNITIES TOP 10 HOLDINGS As of 04/30/2024 | |
| % of Net Assets* | |
| Silergy Corp | 3.3% |
| FPT Corp | 3.1% |
| Sporton International, Inc. | 2.5% |
| Techtronic Industries Co Limited | 2.5% |
| Regional SAB de cv | 2.3% |
| Inter Cars SA | 2.1% |
| Sinbon Electronics Co., Limited | 2.1% |
| Globant S.A. | 2.0% |
| Patria Investments Limited | 1.7% |
| Grupo Mateus SA | 1.6% |
| Total | 23.3% |
| US STALWARTS TOP 10 HOLDINGS As of 04/30/2024 | |
| % of Net Assets* | |
| Littelfuse, Inc. | 4.1% |
| Pjt Partners, Inc. | 3.1% |
| Elastic N.V. | 2.6% |
| Ares Management Corporation | 2.6% |
| Monolithic Power Systems, Inc. | 2.2% |
| Techtronic Industries Co Limited | 2.2% |
| Crowdshare Holdings, Inc. | 2.2% |
| Silicon Laboratories, Inc. | 2.0% |
| Ollie’s Bargain Outlet Holdings, Inc. | 2.0% |
| JFrog Ltd. | 2.0% |
| Total | 24.8% |
*Holdings are subject to change and do not constitute a recommendation or solicitation to buy or sell a particular security. Current and future holdings are subject to risk. Total amount subject to rounding.
CFA® is a trademark owned by CFA Institute. The Chartered Financial Analyst (CFA) designation is issued by the CFA Institute. Candidates must meet one of the following prerequisites: undergraduate degree and 4 years of professional experience involving investment decision-making, or 4 years qualified work experience (full time, but not necessarily investment related). Candidates are then required to undertake extensive self-study programs (250 hours of study for each of the 3 levels) and pass examinations for all 3 levels.
Grandeur Peak Funds are distributed by Northern Lights Distributors, LLC (Member FINRA). Eric Huefner, Todd Matheny, Jesse Pricer and Amy Johnson are registered representatives of Foreside Financials Services LLC, which is not affiliated with Grandeur Peak Global Advisors or its affiliates. Northern Lights Distributors, LLC is not affiliated with Grandeur Peak Global Advisors, LLC or Foreside Financial Services, LLC US Capital Markets Advisors. ©2024 Grandeur Peak Global Advisors, LLC.