Contents
Market Commentary
Portfolio Commentary
Notes from the Road
Business Update
Total Returns | As of September 30, 2024
Market Commentary
Key Takeaways
- The US has produced exceptional earnings growth and market performance over the past decade.
- This performance may be difficult to repeat in the next decade if the US government is unable to implement or maintain policies that promote relatively favorable economic conditions.
- Small cap markets have also produced exceptional earnings growth; however, market returns have not followed.
- As a result, the small cap price-to-earnings (P/E) multiple[1] premium investors were once willing to pay has diminished to a point where they trade in-line or at a discount to large caps.
- Going forward, if current small cap stocks continue to produce superior earnings growth and their P/E multiples maintain current relative valuations or revert to commanding a premium, investors potentially stand to benefit.
American Exceptionalism
“American Exceptionalism” is a term that has been used in academic and political discourse over the past two centuries to describe the belief that the United States is exemplary in many ways relative to the rest of the world. The term has also been used increasingly amongst investors over the past decade, and for good reason. When we look back over the past decade at the US equity market’s relative earnings growth, it has indeed been exceptional. Fortunately for US equity market investors, the exceptional earnings growth has been accompanied by exceptional performance (Exhibit 1).
Exhibit 1
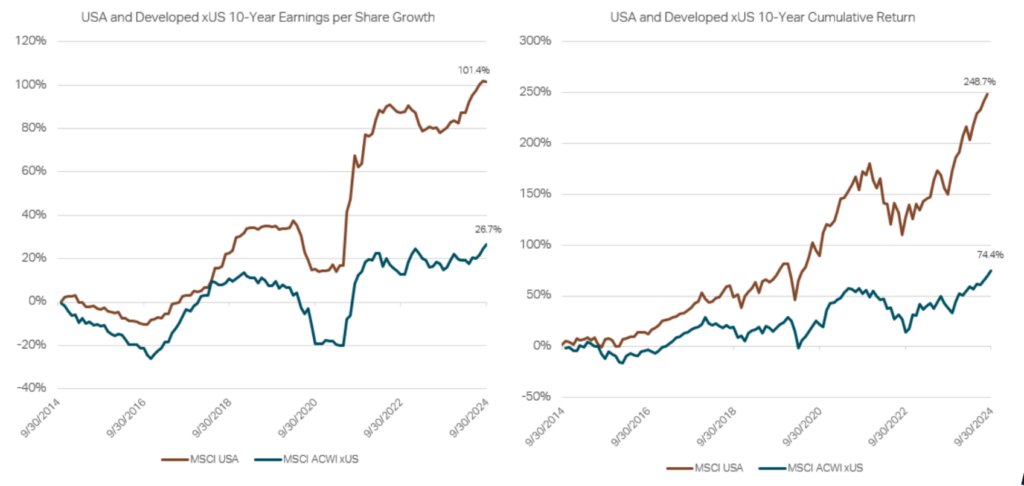
Source: Factset, September 30, 2024. EPS is Earnings-Per-Share, a measure of a company’s profitability, calculated by dividing the company net income by the total number of shares outstanding.
What factors have been the main drivers behind the US market’s exceptional earnings growth? Some commonly cited attributes are demographics, a more stable political system, innovation, and better overall economic conditions. Others may point to exceptionally accommodative monetary policy and aggressive budget deficits as the main catalysts (Exhibit 2).
Exhibit 2
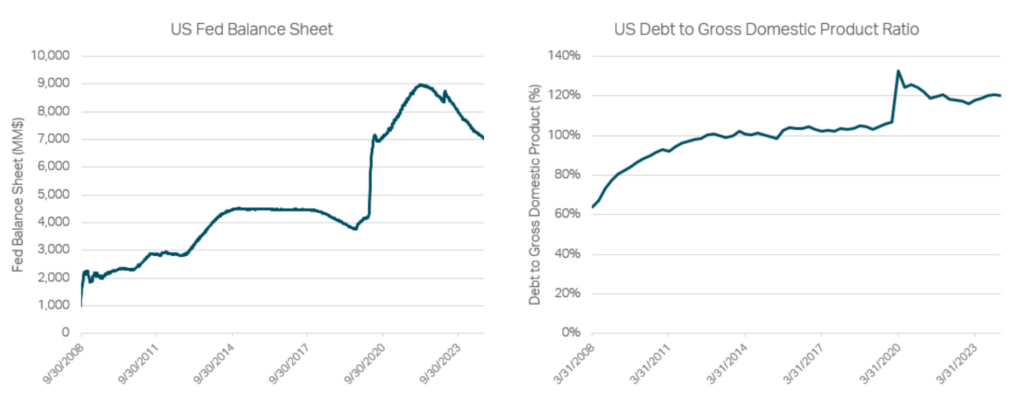
Source: St. Louis Fed, September 30, 2024 and March 31, 2024 GDP is Gross Domestic Product, the value of all the goods and services produced by a country over a certain time period, and is used as a measure of a country’s economic health.
Looking forward, investors must determine if the US market’s exceptional relative earnings growth is sustainable. If the US government is not able to implement or maintain policies that promote relatively favorable economic conditions, it may be difficult for the US to maintain its exceptional status. Investors should also recognize that the US equity market’s outperformance may have exceeded what would be justified by its superior earnings growth. As a result, the US market now commands a relatively large premium relative to other segments of the equity market that may not be appropriate if it does not continue to produce exceptional results.
Small Cap Exceptionalism
Many investors may have overlooked that the US is not the only segment of the global equity market that has produced exceptional earnings growth. Small cap market fundamentals have also proven to be superior during the past decade (Exhibit 3).
Exhibit 3
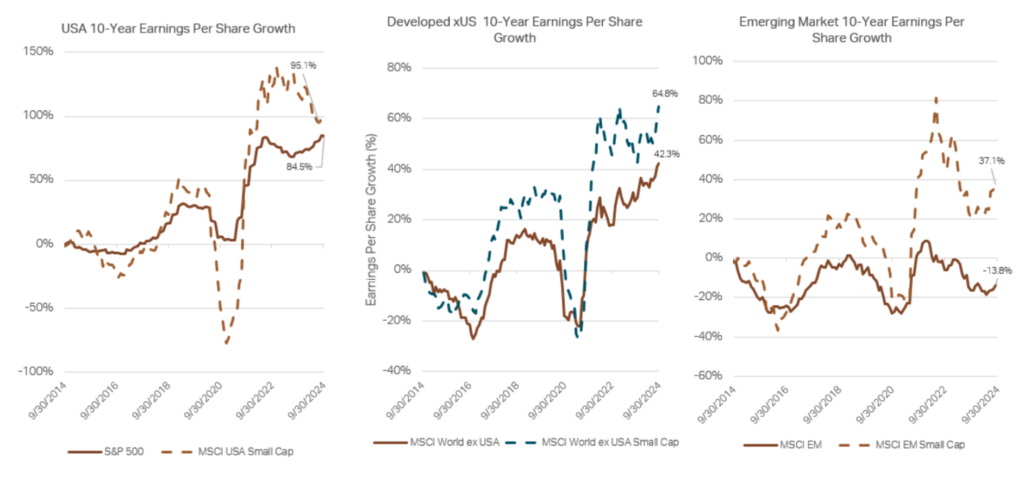
Source: Factset, September 30, 2024
However, in contrast to the US large cap market, small cap markets have either underperformed their large cap counterparts in absolute terms or outperformed by less than what would be justified by their higher earnings growth (Exhibit 4).
Exhibit 4
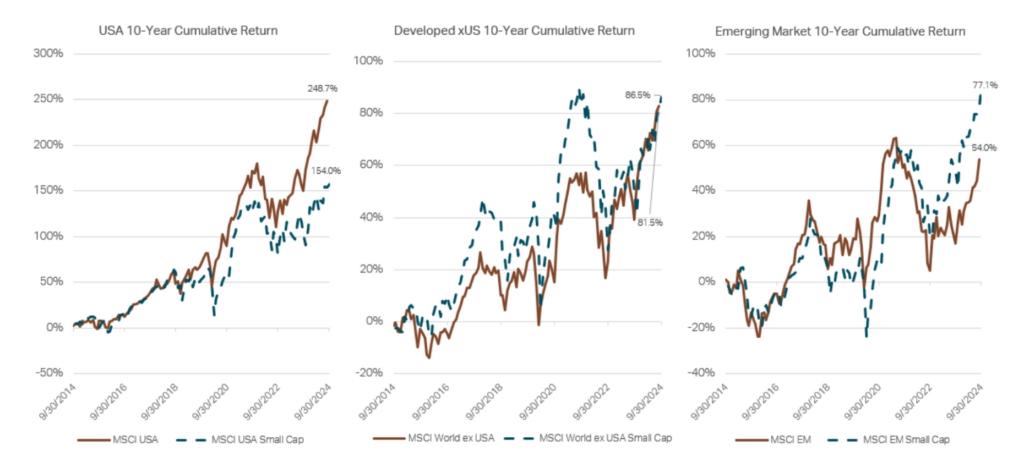
Source: Factset, September 30, 2024
As a result, the small cap P/E multiple premium investors were once willing to pay, given a superior earnings growth profile, has diminished. In many cases, small caps now trade at a discount to larger cap markets. As illustrated in exhibit 5 below, over the past decade, the relative P/E multiple of the MSCI ACWI Small Cap Index[2] had fallen from a +8 point P/E multiple premium to a -2 point P/E discount relative to US large cap stocks. In other words, relative to US large caps, small caps traded at a ~40% premium to US large caps a decade ago and now trade at a ~7% discount.
Exhibit 5
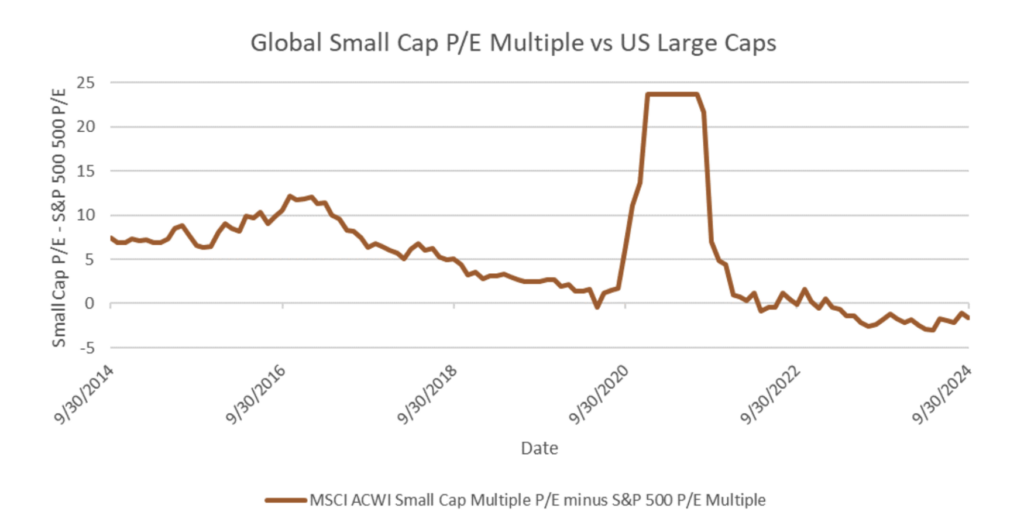
Source: MSCI, Factset, September 30, 2024 The S&P 500 Index is a market-cap weighted index of the 500 leading publicly traded companies in the United States.
As we look forward, there are three possible scenarios to consider when it comes to small cap markets relative to large caps. Small cap P/E multiples can either (1) revert to commanding a premium, (2) continue to trade in-line or at a modest discount, or (3) trade at an even steeper discount. If we assume that small cap markets will continue to generate higher earnings growth than their larger cap counterparts, small cap investors may realize better relative price performance under scenarios (1) and (2). As a result of these current relative valuations, we believe investors now have a very attractive opportunity to allocate or increase their allocation to global small cap equities.
Portfolio Commentary
Quarterly Performance Key Takeaways
- Despite strong absolute performance in Q3, our portfolios continue to lag their benchmarks year-to-date, with the exceptions of Global Contrarian and Global Micro Cap.
- Industrials was the strongest sector in Q3, with the largest contribution coming from BayCurrent, Inc., a Japanese strategy and IT consulting firm which struggled the first half of the year.
- Technology stocks were generally our largest detractor this quarter. We continue to be overweight and believe we own compelling companies with long-term drivers of growth.
- With interest rates falling in multiple developed markets, our Financials portfolio had a strong quarter of performance. We remain underweight to Real Estate which detracted from relative performance, but our larger weight Financials names have been some of the biggest contributors to performance this quarter and year to date.
- China saw a significant rebound at the end of the quarter after the government announced monetary easing policies, aimed at reaching the country’s target GDP growth rate of 5%. Policy effectiveness is still to be determined but we believe many small cap stocks remain attractively valued.
- Our portfolio companies continue to maintain strong fundamentals as we remain focused on delivering attractive captured earnings growth.
- As markets stabilize and fundamentals regain traction, we believe our portfolios have the potential to deliver attractive investment returns.
Q3 exhibited the strongest absolute performance so far this year in our portfolios and also in our various benchmarks outside of the United States (US). It’s likely that the strength at a broad level is the result of a new environment of declining interest rates. As interest rates in the US and Europe march lower and investors search for higher return segments of the market, we anticipate a reversal in the two-year trend of global/international small cap outflows (Exhibit 6).
Exhibit 6
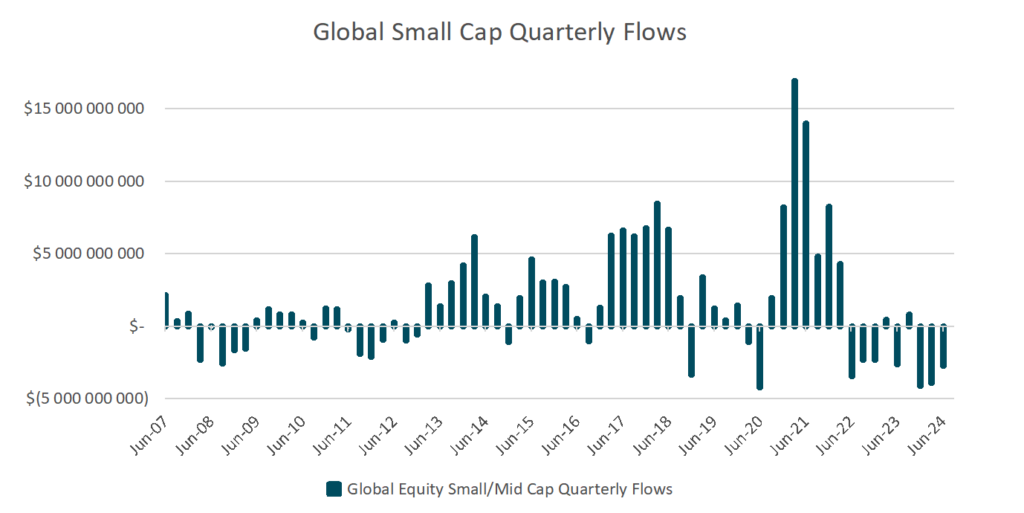
Source: Morningstar Direct, June 30, 2024
Despite the stronger absolute performance, our Funds continued to lag their benchmarks through Q3, with the exceptions of Global Contrarian and Global Micro Cap.
After outperforming in Q2, Technology stocks were the largest detractor this quarter. We maintain an overweight in the sector as we believe we own compelling companies tied to the long-term themes of digital transformation, internet of things (IoT), artificial intelligence (AI), and cyber security. Stocks related to these themes lagged both in our portfolios and in the indices. The good news is that we feel confident about the majority of this quarter’s detractors and many of them are already bouncing back in the early days of October.
Industrials was our strongest performing sector in the third quarter, outperforming the benchmark in each of our funds. The largest contributor was BayCurrent Inc.[3], a Japanese strategy and IT consulting firm. The stock struggled in the first half of the year, unjustifiably in our opinion. Believing the name was undervalued, our Industrials team did a great job making sure all eligible strategies had a full allocation going into the quarter, and it paid off handsomely as the stock was up over 85% in Q3.
In Consumer, it felt more like a quarter where we just didn’t keep up as opposed to a quarter where we had big losers. For the most part we have conviction to add to the names that have detracted this quarter. We continue to feel good about our exposure and are looking to increase weight in the sector. We are finding attractive quality, valuation, and momentum (QVM) profiles in several geographies right now and broadly speaking, consumer looks like a bargain relative to its historical average. Particularly in the US, we think we are getting good shots at some very compelling companies.
It’s interesting to see how much the home-related stocks (builders, home improvement, furnishing, houseware) roared this quarter on the anticipation and initiation of rate cuts. We’ve been screening through the benchmark’s top performing stocks, and outside of a small handful, they unfortunately aren’t profiles that fit our investment philosophy.
Financial stocks had a very strong quarter, largely due to increasing clarity on the interest rate trajectory and timeline. We were mostly able to keep up, but our underweight to Real Estate detracted from relative performance. A highlight of the quarter and year has been that our larger weight names have been our biggest contributors to performance.
The list of detractors within Financials was short in the quarter, limited primarily to Mexico, due to election uncertainty, and Japan, due to macro and regulatory challenges. We generally see these as more transitory issues in nature.
The Health Care index started to recover in Q3 and was the second-best performing sector after Financials. Our performance in Q3 also trended in the right direction and was better than previous quarters. We see this as an opportunity to add to our exposure in the sector and have been actively screening and doing calls with management teams.
Emerging market (EM) health care outperformed developed and the US, driven by continued strong performance in India and the rapid rally in China in the last few days of the quarter. We were underweight EM in most funds due to valuation sensitivity in India and lowered exposure in China. As a result, we couldn’t keep up with the strong EM performance in the index.
Meaningful restructuring at large pharmaceutical companies and biotech funding trends continue to be the major themes in the industry. We are monitoring closely as these are relevant for life sciences tools & services companies, which are areas of the market we tend to be overweight.
China saw a significant rebound the end of the quarter after the government introduced a slew of monetary easing policies in an attempt to reach their 5% growth target. However, the underlying fundamentals are still very weak and it will take time to see if the new policies are effective. Longer-term we are still bullish on China. Despite the recent rally, small cap stocks continues to look attractively valued (Exhibit 7), and policy-wise, more fiscal stimulus could be in the works. If we see real estate policies begin to stabilize property prices, and the stock market continue to rally, we anticipate the population could unleash some of its savings to boost consumption. We believe there’s a good chance Q3 earnings will be weak, so we’re treading carefully and not letting positions get too large.
Exhibit 7
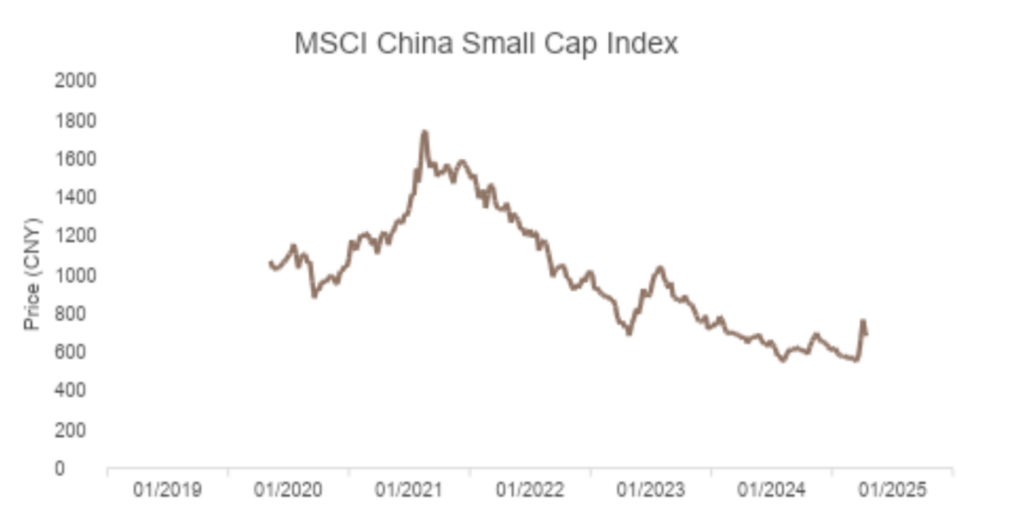
Source: Factset, October 15, 2024
Speaking of large positions, we’ve seen a dramatic shift in emerging markets exposure at the index level. Our exposure to EM has been pretty constant, but slightly lower in recent years, while the index has increased exposure dramatically (Exhibit 8).
Exhibit 8
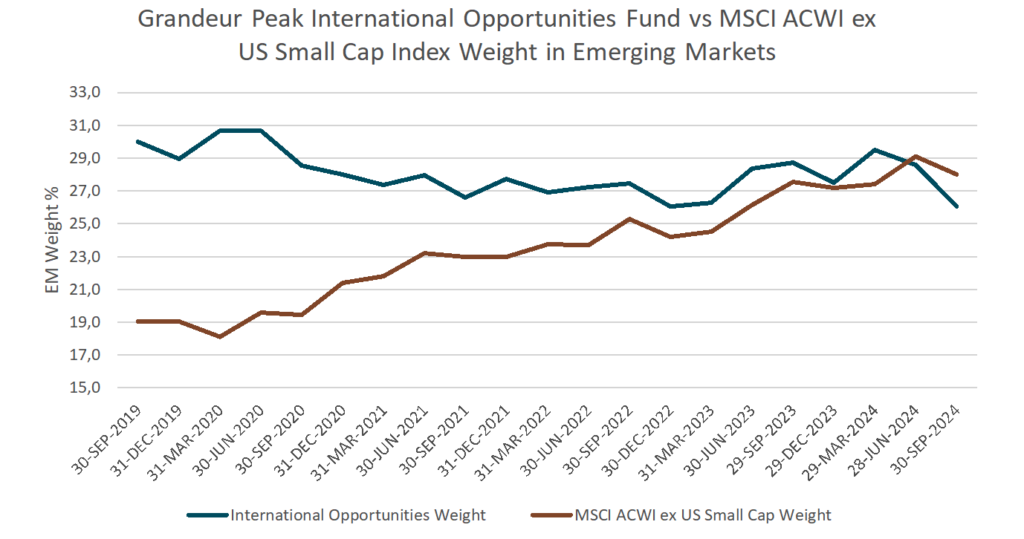
Source: MSCI, Factset, September 30, 2024
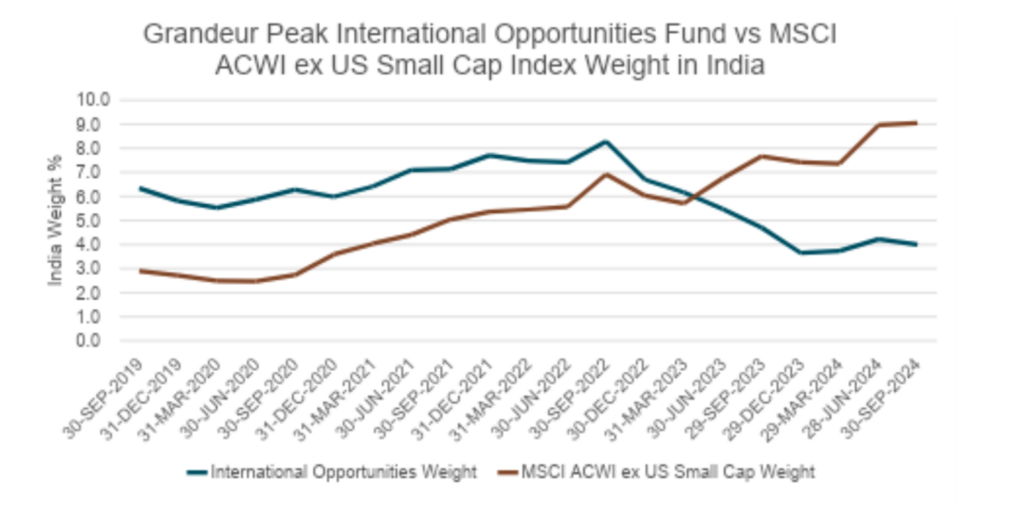
The main contributor to this shift is weight in India (Exhibit 9). While we’ve trimmed positioning across funds due to excessive valuation, the MSCI ACWI ex US Small Cap index has tripled its India weight over the last 5 years. In our International Opportunities portfolio, this has resulted in a ~3.5% overweight to a ~5% underweight over 5 years. Just as inexpensive China jumped in September, expensive India has the potential to fall on the whiff of negative data.
Exhibit 9
Source: MSCI, Factset, September 30, 2024
In the US, we underperformed in every fund except for Global Micro Cap. Financials was the bright spot where we beat the benchmark in every fund. Tech is probably the standout among the detractors here. It’s just an extremely volatile market in tech right now where the bar for execution is even higher than normal.
North America is looking relatively expensive on the whole. We’ve screened regularly this year and it’s feeling more difficult to find ideas than this time last year. Relative to other geographies, expected returns, earnings growth, returns on capital, and balance sheets are all less attractive on average, but price/earnings multiples sit at large premiums. At current valuations, we’d like to be more certain that business momentum will come through, and that’s probably still the biggest worry right now from a top-down point of view.
Notes from the Road
Company Touch Tracker
This quarter our team engaged with 388 companies across the world, putting our trailing 12-month company touches at 1,635.
This past quarter, team members traveled domestically to Massachusetts, Texas, Tennessee, California, Illinois, and Missouri. Internationally, team members traveled to Italy, Sweden, Greece, Belgium, Finland, Denmark, Norway, South Korea, Mexico, China, and Germany.
South Korea Recap
Phil Naylor, Research Analyst and Portfolio Manager, and Blake Walker, Research Analyst, Portfolio Manager, and CEO traveled to South Korea in September. Here are some of Phil’s thoughts on their research trip.
South Korea still doesn’t feel like an emerging market country. Its cleanliness feels more on par with Japan than India. The infrastructure, with bridges and tunnels nearly everywhere around Seoul, rivals that of any major city. Unfortunately, so does the traffic. The food is clean, diverse, and delicious. South Korea is home to several well-managed, globally known mega-cap companies including Samsung, LG, Hyundai, and Kia[4]. Interestingly, while the IMF (International Monetary Fund)[5], FTSE Russell[6], S&P Dow Jones Indices[7] all classify South Korea as a developed country, MSCI[8] still classifies it as an emerging market. This is, at least in large part, because of the South Korean government’s blanket short-selling ban. The MSCI in June 2024 said, “The recent short-selling ban introduces market accessibility restrictions. While this ban is expected to be temporary, sudden changes in market rules are not desirable.” Regardless of how long this emerging classification lasts, we remain interested in South Korea.
During our trip, we visited 22 companies, focusing primarily on companies that play into the technology value chain and cosmetics. In the technology sector’s value chain, two main challenges stand out for us: (1) finding high-quality companies that don’t carry an excessive amount of customer-specific, idiosyncratic risk, and (2) trusting management teams’ claims. On the first point, the challenge arises because South Korea is dominant in memory-based semiconductor technologies, which has only three main global producers: Samsung Electronics, SK Hynix, and Micron[9]. Another large subset of Korean companies are focused on the mobile handset and display markets, which are both also dominated by a small number of players. Addressing the second challenge, we have learned over the years that South Korean management teams love to sizzle without always delivering the steak. These visits were helpful because they allowed us to meet multiple people and address more questions from different angles – ultimately triangulating what we believe will be the truth.
We left most excited about companies benefiting from brand and technology exports while skirting any risks associated with South Korea’s declining population. In June 2024, President Yoon Suk Yeol declared the low birthrate in South Koreas to be a “demographic national emergency.” The fertility rate fell to 0.72, down from 0.78 last year, significantly below the 2.1 children-per-woman rate needed to maintain the population. Not surprisingly, the number of marriages has also dropped. For context, Japan, which faces its own demographic challenges, had a birthrate of 1.2 in 2023, while China’s was 1.7. The United States sits at 1.6, though it benefits from immigration.
As investors, we find South Korea’s ability to export its brand increasingly appealing. What is the South Korea “brand”?
K-Pop: Psy, BTS, NewJeans, BLɅϽKPIИK – musical groups originating in Korea
K-Drama: SquidGame, Pachinko, Parasite, Crash Landing on You – recent films and television series based on Korean games, cultural references, and soap-opera style dramas
K-Cuisine: Korean BBQ and Bibimbap have long been popular, but more recently concepts like Cupbop, a take-away rice bowl with a variety of toppings, have emerged
K-Beauty: Over 30,000 cosmetic brands – independent and more developed – are growing across the US and beyond.
A decade ago, how many of these were a part of your life? Today, we’re all familiar with at least a few of them. It’s fascinating how South Korea has managed to attach the “K” to so many cultural exports. Has any other country successfully branded such a large portion of its exports? Indeed, the government has included this cultural exporting as a stated goal in hopes of becoming a top global cultural power.
It’s no secret that South Korea is a powerhouse in technology exports. Home to Samsung and Hynix, South Korea has long held a dominant position in memory-based semiconductor technologies. There is an entire ecosystem supporting these businesses. Now, companies that had for many years only sold to producers of legacy memory-based semiconductor technology are expanding into differentiated HBM3e and HBM4 memory, and even into logic-based technologies. Companies who historically focused on displays are now applying their R&D to foldable screens and wearables. Companies who had Intellectual Property (IP) for one technology are creating IP for other adjacent technologies. Much of that innovation ends up outside of South Korea. Despite a tough year for many tech companies, the backlog, and conversations we had suggest this could be a compelling time to invest in certain South Korean tech names. Importantly, we aim to get secular trends right, and based on the earnings power of some of the companies we visited, we walked away from this trip with increased confidence in certain actionable ideas.
On the cosmetics front, we visited established brands, the independent brands, Original Design Manufacturers (ODMs), and distributors. The rise of K-Beauty, driven largely by exports, has led to strong stock performance for many companies over the past year, but we still believe there are good opportunities to find capital appreciation. One company told us they believed the industry was in the 2nd Inning as it related to K-Beauty exports.
Whether South Korea remains classified as Emerging or is full accepted as a Developed country, we continue to be intrigued by the investment opportunities we can find across a variety of sectors.
Business Update
The Grandeur Peak Global Contrarian Fund (GPGCX) celebrated its five-year mark this quarter. The Fund was launched on Sept 17, 2019, and was designed to offer clients a value-focused strategy that adheres to similar quality characteristics as our growth-focused funds. Over its first five years, the Fund has returned 14.07% annualized return since inception, as of September 30, 2024. Comparatively, the MSCI ACWI Small Cap Index[10] returned 9.48% over the same time period. Mark Madsen, CFA®, Lead Portfolio Manager since the Fund’s inception noted,
“We think our focus on quality at compelling valuation combined with our emphasis on being contrarian has allowed us to successfully navigate the volatility. Our strength continues to be in identifying companies from across the globe that fit in one of our investment types, such as Fallen Angels[11] or Core Contrarians[12]. Quality companies that are in out-of-favor industries or have hit a bump in the road can have quite attractive valuations relative to their long-term potential, giving us interesting investment opportunities.”
The third quarter also included a handful of updates to our portfolio manager (PM) assignments, which we believe will strengthen our PM coverage and focus.
- Conner Whipple was removed as a Portfolio Manager on the Global Reach Fund (GPRIX/GPROX), to allow him more time to focus on his Analyst and Europe responsibilities.
- The industry PMs for Global Reach Fund remain unchanged:
- Health Care: Liping Cai
- Technology: Phil Naylor
- Consumer: Tyler Glauser
- Financials: Brad Barth
- Industrials, Energy & Materials: Mark Madsen
- Because the Global Reach Fund is an important umbrella portfolio, Randy Pearce, Juliette Douglas, and Amy Hu Sunderland remain PMs in supporting and oversight roles.
- Dane Nielson, CFA®, has been promoted to be a Portfolio Manager on the Global Explorer Fund (GPGEX), and will be the lead geography PM for North America, replacing Randy Pearce in this role.
- Phil Naylor was removed as a Portfolio Manager on the Global Explorer Fund, to allow him to focus on his Analyst and Technology responsibilities.
- The other geographies PMs (besides North America) remain unchanged:
- Asia Pacific: Spencer Hackett
- Europe: Conner Whipple
- North America: Dane Nielson
- Emerging Markets: Amy Hu Sunderland, Liping Cai (China), and Ben Gardiner (India)
- Because the Global Explorer Fund is an important umbrella portfolio, Randy Pearce, Blake Walker, and Juliette Douglas maintain PMs in supporting and oversight roles.
The SEC introduced Tailored Shareholder Reports (TSRs) in July 2024, which required us to change our primary benchmark index for each fund to what the SEC calls a “broad-based” index. Because our portfolios have a more niche focus, these broad-based indices are broader than what we have historically considered to be the primary index for each of our Funds. These new indices have been included in our most recent Prospectus dated Sept 1, 2024, and are now reflected in our other materials as well. The previous benchmarks we believe provide a nearer comparison to our Fund portfolios and are generally still included in the materials as space allows. We remain benchmark agnostic in our portfolio creation and management.
Below you’ll find a reference guide with the new Primary benchmarks and the highlighted benchmark, which we believe is most closely aligned with the respective Fund strategy.
| Status | Fund Name | Primary Benchmark | Secondary Benchmark | Tertiary Benchmark |
| Prior | Emerging Markets Opportunities | MSCI Emerging Markets SMID Cap | MSCI Emerging Markets IMI | |
| New | Emerging Markets Opportunities | MSCI Emerging Markets IMI | MSCI Emerging Markets SMID Cap | |
| Prior | Global Contrarian | MSCI ACWI Small Cap | MSCI ACWI Small Cap Value | MSCI ACWI ex USA Small Cap |
| New | Global Contrarian | MSCI ACWI IMI | MSCI ACWI Small Cap | MSCI ACWI ex USA Small Cap |
| Prior | Global Explorer | MSCI ACWI Small Cap | MSCI ACWI IMI | |
| New | Global Explorer | MSCI ACWI IMI | MSCI ACWI Small Cap | |
| Prior | Global Micro Cap | MSCI ACWI Small Cap | MSCI World Micro Cap | MSCI ACWI ex USA Small Cap |
| New | Global Micro Cap | MSCI ACWI IMI | MSCI World Micro Cap | MSCI ACWI Small Cap |
| Prior | Global Opportunities | MSCI ACWI Small Cap | MSCI ACWI IMI | |
| New | Global Opportunities | MSCI ACWI IMI | MSCI ACWI Small Cap | |
| Prior | Global Reach | MSCI ACWI Small Cap | MSCI ACWI IMI | |
| New | Global Reach | MSCI ACWI IMI | MSCI ACWI Small Cap | |
| Prior | Global Stalwarts | MSCI ACWI Mid Cap | MSCI ACWI Small Cap | |
| New | Global Stalwarts | MSCI ACWI IMI | MSCI ACWI Mid Cap | MSCI ACWI Small Cap |
| Prior | International Opportunities | MSCI ACWI ex USA Small Cap | MSCI ACWI ex USA IMI | |
| New | International Opportunities | MSCI ACWI ex USA IMI | MSCI ACWI ex USA Small Cap | |
| Prior | International Stalwarts | MSCI ACWI ex USA Mid Cap | MSCI ACWI ex USA Small Cap | |
| New | International Stalwarts | MSCI ACWI ex USA IMI | MSCI ACWI ex USA Mid Cap | MSCI ACWI ex USA Small Cap |
| Prior | US Stalwarts | MSCI USA Mid Cap | MSCI USA Small Cap | |
| New | US Stalwarts | MSCI USA IMI | MSCI USA Mid Cap | MSCI USA Small Cap |
Our firm assets held steady at approximately $5.9 billion in assets under management (AUM) this quarter.
As always, please feel free to reach out any time with any questions, requests, or comments. We appreciate the opportunity to work on your behalf.
Sincerely,
Todd Matheny, CAIA®
Jesse Pricer, CFA®
Amy Johnson, CFP®
The Grandeur Peak Client Team
Total Returns | As of September 30, 2024
| CUMULATIVE | ANNUALIZED | |||||||
| QTR | YTD | 1 YR | 3 YR | 5 YR | 10 YR | SINCE FUND INCEPTION | ||
| Global Contrarian, Institutional Class (GPGCX) | 10.04% | 14.00% | 27.56% | 5.74% | 14.34% | n/a | 14.07% | |
| MSCI ACWI IMI Index [I] | 6.95% | 18.24% | 31.55% | 7.95% | 12.39% | n/a | 12.07% | |
| MSCI ACWI Small Cap Index [II] | 8.92% | 11.69% | 25.20% | 3.09% | 9.90% | n/a | 9.48% | |
| MSCI ACWI ex USA Small Cap Index [III] | 9.03% | 12.38% | 23.84% | 1.90% | 8.69% | n/a | 8.50% | |
| Global Explorer, Institutional Class (GPGEX) | 8.15% | 4.56% | 19.33% | n/a | n/a | n/a | -5.40% | |
| MSCI ACWI IMI Index | 6.95% | 18.24% | 31.55% | n/a | n/a | n/a | 7.07% | |
| MSCI ACWI Small Cap Index | 8.92% | 11.69% | 25.20% | n/a | n/a | n/a | 3.82% | |
| Global Micro Cap, Institutional Class (GPMCX) | 10.49% | 9.85% | 24.55% | -6.44% | 11.19% | n/a | 9.40% | |
| MSCI ACWI IMI Index | 6.95% | 18.24% | 31.55% | 7.95% | 12.39% | n/a | 10.93% | |
| MSCI World Micro Cap Index [IV] | 7.98% | 7.97% | 18.82% | -3.93% | 7.53% | n/a | 7.07% | |
| MSCI ACWI Small Cap Index | 8.92% | 11.69% | 25.20% | 3.09% | 9.90% | n/a | 8.98% | |
| Global Opportunities, Investor Class (GPGOX) | 7.62% | -2.13% | 13.07% | -8.15% | 8.08% | 7.60% | 10.62% | |
| Global Opportunities, Institutional Class (GPGIX) | 7.71% | -2.08% | 13.68% | -7.90% | 8.40% | 7.85% | 10.91% | |
| MSCI ACWI IMI Index | 6.95% | 18.24% | 31.55% | 7.95% | 12.39% | 9.75% | 10.98% | |
| MSCI ACWI Small Cap Index | 8.92% | 11.69% | 25.20% | 3.09% | 9.90% | 8.28% | 10.02% | |
| Global Reach, Investor Class (GPROX) | 8.45% | 4.31% | 18.80% | -7.22% | 8.02% | 7.43% | 8.84% | |
| Global Reach, Institutional Class (GPRIX) | 8.47% | 4.51% | 19.04% | -7.00% | 8.28% | 7.68% | 9.10% | |
| MSCI ACWI IMI Index | 6.95% | 18.24% | 31.55% | 7.95% | 12.39% | 9.75% | 10.17% | |
| MSCI ACWI Small Cap Index | 8.92% | 11.69% | 25.20% | 3.09% | 9.90% | 8.28% | 8.75% | |
| Global Stalwarts, Investor Class (GGSOX) | 6.01% | 0.48% | 18.38% | -10.28% | 6.08% | n/a | 8.08% | |
| Global Stalwarts, Institutional Class (GGSYX) | 6.10% | 0.72% | 18.70% | -10.04% | 6.36% | n/a | 8.36% | |
| MSCI ACWI IMI Index | 6.95% | 18.24% | 31.55% | 7.95% | 12.39% | n/a | 11.39% | |
| MSCI ACWI Mid Cap Index [V] | 9.95% | 13.84% | 26.91% | 4.00% | 9.54% | n/a | 9.19% | |
| MSCI ACWI Small Cap Index | 8.92% | 11.69% | 25.20% | 3.09% | 9.90% | n/a | 9.33% | |
| Intl Opportunities, Investor Class (GPIOX) | 8.36% | -0.85% | 13.63% | -9.46% | 5.48% | 5.27% | 8.84% | |
| Intl Opportunities, Institutional Class (GPIIX) | 8.26% | -0.84% | 13.76% | -9.28% | 5.72% | 5.51% | 9.07% | |
| MSCI ACWI ex USA IMI Index | 8.29% | 14.38% | 25.67% | 4.27% | 8.17% | 5.82% | 6.82% | |
| MSCI ACWI ex USA Small Cap Index | 9.03% | 12.38% | 23.84% | 1.90% | 8.69% | 6.51% | 7.54% | |
| Intl Stalwarts, Investor Class (GISOX) | 6.41% | -0.22% | 17.38% | -9.65% | 6.52% | n/a | 8.25% | |
| Intl Stalwarts, Institutional Class (GISYX) | 6.40% | -0.06% | 17.65% | -9.43% | 6.79% | n/a | 8.51% | |
| MSCI ACWI ex USA IMI Index [VI] | 8.29% | 14.38% | 25.67% | 4.27% | 8.17% | n/a | 7.56% | |
| MSCI ACWI ex USA Mid Cap Index [VII] | 9.79% | 12.36% | 23.39% | 2.34% | 6.98% | n/a | 6.84% | |
| MSCI ACWI ex USA Small Cap Index | 9.03% | 12.38% | 23.84% | 1.90% | 8.69% | n/a | 7.82% | |
| EM Opportunities, Investor Class (GPEOX) | 3.57% | 0.31% | 7.74% | -5.97% | 5.19% | 4.02% | 4.74% | |
| EM Opportunities, Institutional Class (GPEIX) | 3.60% | 0.53% | 8.05% | -5.75% | 5.43% | 4.26% | 4.98% | |
| MSCI Emerging Markets IMI Index [VIII] | 8.40% | 16.64% | 26.08% | 1.44% | 6.93% | 4.64% | 4.74% | |
| MSCI Emerging Markets SMID Index [IX] | 7.48% | 12.62% | 22.82% | 3.82% | 9.77% | 5.07% | 5.38% | |
| US Stalwarts, Institutional Class (GUSYX) | 6.37% | 3.60% | 23.02% | -6.18% | n/a | n/a | 16.95% | |
| MSCI USA IMI Index [X] | 6.18% | 20.66% | 35.31% | 10.40% | n/a | n/a | 23.05% | |
| MSCI USA Mid Cap Index [XI] | 10.11% | 15.24% | 30.31% | 5.47% | n/a | n/a | 21.72% | |
| MSCI USA Small Cap Index [XII] | 8.83% | 11.04% | 26.43% | 4.12% | n/a | n/a | 22.05% | |
An investor should consider investment objectives, risks, charges, and expenses carefully before investing. To obtain a Grandeur Peak Funds prospectus, containing this and other information, visit www.grandeurpeakglobal.com or call 1-855-377-PEAK (7325). Please read it carefully before investing.
The performance data quoted represents past performance. Current performance may be lower or higher than the data quoted above. Past performance is no guarantee of future results. The investment return and principal value of an investment will fluctuate so that investor’s shares, when redeemed, may be worth more or less than their original cost. For performance information current to the most recent month-end, please call 1-855-377-PEAK (7325).
The Advisor may absorb certain Fund expenses, without which total return would have been lower. Net Expense Ratio reflect the expense waiver, if any, contractually agreed to through September 1, 2025. A 2% redemption fee will be deducted on fund shares held 60 days or less. Performance data does not reflect this redemption fee or taxes.
| TOTAL EXPENSE RATIOS & INCEPTION DATES | |||||||||
| Inception Date | INVESTOR | INSTITUTIONAL | |||||||
| Fund | Gross | Net | Gross | Net | |||||
| Global Contrarian (GPGCX) | 09/17/2019 | 1.35% | 1.35% | ||||||
| Global Explorer (GPGEX) | 12/16/2021 | 3.14% | 1.25% | ||||||
| Global Micro Cap (GPMCX) | 10/20/2015 | 2.01% | 2.00% | ||||||
| Global Opportunities (GPGOX/GPGIX) | 10/17/2011 | 1.63% | 1.58% | 1.38% | 1.33% | ||||
| Global Reach (GPROX/GPRIX) | 06/19/2013 | 1.55% | 1.50% | 1.30% | 1.25% | ||||
| Global Stalwarts (GGSOX/GGSYX) | 09/01/2015 | 1.27% | 1.27% | 1.03% | 1.03% | ||||
| International Opportunities (GPIOX/GPIIX) | 10/17/2011 | 1.64% | 1.61% | 1.39% | 1.36% | ||||
| International Stalwarts (GISOX/GISYX) | 09/01/2015 | 1.17% | 1.17% | 0.92% | 0.92% | ||||
| Emerging Markets (GEPOX/GPEIX) | 12/16/2013 | 1.83% | 1.81% | 1.58% | 1.56% | ||||
| US Stalwarts (GUSYX) | 03/19/2020 | 0.90% | 0.90% | ||||||
There is no assurance that these opinions or forecasts will come to pass, and past performance is no assurance of future results.
RISKS: Investing in small and micro-cap funds will be more volatile and loss of principal could be greater than investing in large cap or more diversified funds. Investing in foreign securities entails special risks, such as currency fluctuations and political uncertainties, which are described in more detail in the prospectus. Investments in emerging markets are subject to the same risks as other foreign securities and may be subject to greater risks than investments in foreign countries with more established economies and securities markets. Diversification does not eliminate the risk of experiencing investment loss.
A Fund’s direct or indirect investments in foreign securities, including depositary receipts, involve risks not associated with investing in U.S. securities that can adversely affect the Fund’s performance. Foreign markets, particularly emerging markets, may be less liquid, more volatile, and subject to less government supervision than domestic markets.
The adviser’s judgments about the growth, value or potential appreciation of an investment may prove to be incorrect or fail to have the intended results, which could adversely impact the Fund’s performance and cause it to underperform relative to other funds with similar investment goals or relative to its benchmark, or not to achieve its investment goal.
[1] P/E Multiple is a valuation metric used to evaluate a company’s stock and is calculated by the ratio of Price to Earnings, or the price of a share of stock over the earnings per share. Exhibit 5 reflects the removal of P/E multiple outliers or observations in the top or bottom deciles.
[2] The MSCI ACWI Small Cap Index is designed to measure the equity market performance of small-cap companies across developed and emerging markets globally.
[3] As of July 31, the Grandeur Peak Funds owned 6,028,400 shares of BayCurrent Inc.
[4] Grandeur Peak Funds owns zero shares in any of these companies as of July 31, 2024
[5] The International Monetary Fund (IMF) works to achieve sustainable growth and prosperity for all of its 190 member countries.
[6] FTSE Russell is a subsidiary of London Stock Exchange Group that produces, maintains, licenses, and markets stock market indices.
[7] The S&P Dow Jones Indices is an independent index provider which licenses its products to a global investment market.
[8] MSCI (Morgan Stanley Capital International) is an investment research firm that provides investment data and analytical services to investors, including index products.
[9] Grandeur Peak Funds owns zero shares in any of these companies as of July 31, 2024.
[10] The MSCI ACWI Small Cap Index is designed to measure the equity market performance of small-cap companies across developed and emerging markets globally.
[11] Grandeur Peak classifies Fallen Angels as growth companies that hit a “bump in the road” with an anticipated rebound.
[12] Grandeur Peak classifies Core Contrarians as quality companies in under-valued industries or geographies.
[I] The MSCI ACWI IMI Index is designed to measure the equity market performance of large, mid, and small-cap companies across developed and emerging markets globally.
[II] The MSCI ACWI Small Cap Index is designed to measure the equity market performance of small-cap companies across developed and emerging markets globally.
[III] The MSCI ACWI ex USA Small Cap Index is designed to measure the equity market performance of small cap companies across developed and emerging markets globally, excluding the United States.
[IV] The MSCI World Micro Cap Index is designed to measure the equity market performance of micro-cap companies across developed markets globally. It does not include emerging markets.
[V] The MSCI ACWI Mid Cap Index is designed to measure the equity market performance of mid-cap companies across developed and emerging markets globally.
[VI] The MSCI ACWI ex USA IMI Index is designed to measure the equity market performance of large, mid, and small cap companies across developed and emerging markets globally, excluding the United States.
[VII] The MSCI ACWI ex USA Mid Cap Index is designed to measure the equity market performance of mid cap companies across developed and emerging markets globally, excluding the United States.
[VIII] The MSCI Emerging Markets IMI Index is designed to measure the equity market performance of large, mid, and small-cap companies across emerging markets.
[IX] The MSCI Emerging Markets SMID Cap Index is designed to measure the equity market performance of small and mid-cap companies across emerging markets.
[X] The MSCI USA IMI Index is designed to measure the performance of the large, mid, and small-cap segments of the US market. With 2,327 constituents, the index covers approximately 99% of the free float-adjusted market capitalization in the US.
[XI] The MSCI USA Mid-Cap Index is designed to measure the performance of the mid cap segments of the US market. With 340 constituents, the index covers approximately 15 percent of the free float-adjusted market capitalization in the US.
[XII] The MSCI USA Small Cap Index is designed to measure the performance of the small cap segment of the US equity market. With 1,781 constituents, the index represents approximately 14 percent of the free float-adjusted market capitalization in the US.
[XIII] The S&P 500 Index is a market-capitalization-weighted index of 500 leading publicly traded companies in the U.S.
[XIV] The MSCI Emerging Markets Index is designed to measure the equity market performance of large and mid-cap companies across emerging markets.
[XV] The MSCI USA Index is designed to measure the equity market performance of large and mid-cap companies in the U.S.
[XVI] The MSCI ACWI ex USA Index is designed to measure the equity market performance of large and mid-cap companies across developed and emerging markets globally, excluding the United States.
[XVII] The MSCI World ex USA Index is designed to measure the equity market performance of large and mid-cap companies across developed markets globally, excluding the United States.
[XVIII] The MSCI Emerging Markets Small Cap Index is designed to measure the equity market performance of small cap companies across emerging markets.
| GLOBAL CONTRARIAN TOP 10 HOLDINGS As of 07/31/2024 | |
| % of Net Assets* | |
| Riverstone Holdings, Ltd. | 5.0% |
| Plover Bay Tech | 5.0% |
| Petershill Partners PLC | 4.3% |
| BayCurrent Consulting, Inc. | 4.1% |
| Beenos Inc | 2.8% |
| Perella Weinberg Partners | 2.0% |
| CVS Group plc | 2.0% |
| FRP Advisory Group PLC | 1.9% |
| FPT Corp | 1.8% |
| Vietnam Technological & Comm Joint-stock Bank | 1.8% |
| Total | 30.8% |
| GLOBAL EXPLORER TOP 10 HOLDINGS As of 07/31/2024 | |
| % of Net Assets* | |
| FPT Corp | 1.3% |
| BayCurrent Consulting, Inc. | 1.2% |
| JTC plc | 1.1% |
| B & M European Value Retail SA | 1.0% |
| Virbac SA | 0.9% |
| Perella Weinberg Partners | 0.9% |
| ULS Group Inc | 0.9% |
| Qualys, Inc. | 0.8% |
| Volution Group PLC | 0.8% |
| Elastic N.V. | 0.8% |
| Total | 9.8% |
| GLOBAL MICRO CAP TOP 10 HOLDINGS As of 07/31/2024 | |
| % of Net Assets* | |
| Pennant Group, Inc. (The) | 3.7% |
| Beenos Inc | 3.0% |
| ULS Group Inc | 2.2% |
| Fiducian Group Ltd | 2.2% |
| Kogan.com Ltd | 2.1% |
| CVS Group plc | 2.1% |
| Volution Group PLC | 2.1% |
| Swedencare AB | 2.0% |
| Barrett Business Services, Inc. | 2.0% |
| Hackett Group, Inc. (The) | 1.9% |
| Total | 23.3% |
| GLOBAL OPPORTUNITIES TOP 10 HOLDINGS As of 07/31/2024 | |
| % of Net Assets* | |
| Littelfuse, Inc. | 3.4% |
| B & M European Value Retail SA | 3.4% |
| BayCurrent Consulting, Inc. | 2.6% |
| Virbac SA | 2.5% |
| Volution Group PLC | 1.9% |
| CVS Group plc | 1.8% |
| Melexis NV | 1.5% |
| JTC plc | 1.4% |
| Silergy Corp | 1.3% |
| Vietnam Technological & Comm Joint-stock Bank | 1.3% |
| Total | 21.1% |
| GLOBAL REACH TOP 10 HOLDINGS As of 07/31/2024 | |
| % of Net Assets* | |
| BayCurrent Consulting, Inc. | 2.1% |
| B & M European Value Retail SA | 1.3% |
| Plover Bay Tech | 1.1% |
| JTC plc | 1.1% |
| Virbac SA | 1.1% |
| CVS Group plc | 1.0% |
| Perella Weinberg Partners | 1.0% |
| Sdiptech AB | 0.9% |
| Silergy Corp | 0.9% |
| Ace Hardware Indonesia Tbk PT | 0.8% |
| Total | 11.2% |
| GLOBAL STALWARTS TOP 10 HOLDINGS As of 07/31/2024 | |
| % of Net Assets* | |
| BayCurrent Consulting, Inc. | 3.6% |
| Littelfuse, Inc. | 3.3% |
| B & M European Value Retail SA | 3.2% |
| Silergy Corp | 2.5% |
| Globant S.A. | 1.7% |
| JTC plc | 1.6% |
| Elastic N.V. | 1.5% |
| Melexis NV | 1.4% |
| Virbac SA | 1.3% |
| Pjt Partners, Inc. | 1.2% |
| Total | 21.3% |
| INTERNATIONAL OPPORTUNITIES TOP 10 HOLDINGS As of 07/31/2024 | |
| % of Net Assets* | |
| B & M European Value Retail SA | 3.1% |
| Volution Group PLC | 2.8% |
| JTC plc | 2.4% |
| BayCurrent Consulting, Inc. | 2.3% |
| Silergy Corp | 2.1% |
| Virbac SA | 2.0% |
| CVS Group plc | 1.7% |
| Sporton International, Inc. | 1.6% |
| Melexis NV | 1.5% |
| Integral Corp | 1.5% |
| Total | 20.9% |
| INTERNATIONAL STALWARTS TOP 10 HOLDINGS As of 07/31/2024 | |
| % of Net Assets* | |
| B & M European Value Retail SA | 4.5% |
| BayCurrent Consulting, Inc. | 4.0% |
| Silergy Corp | 2.7% |
| Melexis NV | 2.5% |
| Diploma plc | 2.4% |
| JFrog Ltd. | 2.2% |
| EQT AB | 2.0% |
| Techtronic Industries Co Limited | 1.9% |
| ICON plc | 1.7% |
| Ashtead Group plc | 1.6% |
| Total | 25.6% |
| EMERGING MARKETS OPPORTUNITIES TOP 10 HOLDINGS As of 07/31/2024 | |
| % of Net Assets* | |
| Silergy Corp | 3.7% |
| Sinbon Electronics Co., Limited | 2.7% |
| Techtronic Industries Co Limited | 2.5% |
| Sporton International, Inc. | 2.4% |
| FPT Corp | 2.4% |
| Inter Cars SA | 2.2% |
| Globant S.A. | 2.1% |
| Regional SAB de cv | 2.1% |
| Patria Investments Limited | 1.8% |
| IndiaMart InterMesh Ltd | 1.8% |
| Total | 23.6% |
| US STALWARTS TOP 10 HOLDINGS As of 07/31/2024 | |
| % of Net Assets* | |
| Littelfuse, Inc. | 4.3% |
| Elastic N.V. | 2.7% |
| Ares Management Corporation | 2.4% |
| Pjt Partners, Inc. | 2.3% |
| JFrog Ltd. | 2.2% |
| Silicon Laboratories, Inc. | 2.1% |
| Charles River Laboratories International, Inc. | 2.0% |
| Grainger (W.W.), Inc. | 2.0% |
| DigitalOcean Holdings, Inc. | 1.9% |
| ICON plc | 1.9% |
| Total | 23.7% |
*Holdings are subject to change and do not constitute a recommendation or solicitation to buy or sell a particular security. Current and future holdings are subject to risk. Total amount subject to rounding.
CFA® is a trademark owned by CFA Institute. The Chartered Financial Analyst (CFA) designation is issued by the CFA Institute. Candidates must meet one of the following prerequisites: undergraduate degree and 4 years of professional experience involving investment decision-making, or 4 years qualified work experience (full time, but not necessarily investment related). Candidates are then required to undertake extensive self-study programs (250 hours of study for each of the 3 levels) and pass examinations for all 3 levels.
Grandeur Peak Funds are distributed by Northern Lights Distributors, LLC (Member FINRA). Todd Matheny, Jesse Pricer and Amy Johnson are registered representatives of Foreside Financials Services LLC, which is not affiliated with Grandeur Peak Global Advisors or its affiliates. Northern Lights Distributors, LLC is not affiliated with Grandeur Peak Global Advisors, LLC or Foreside Financial Services, LLC. ©2024 Grandeur Peak Global Advisors, LLC.
