
Contents
Market Commentary
Portfolio Commentary
Notes from the Road
Business Update
Total Returns | As of December 31, 2024
Market Commentary
Key Takeaways
- The S&P 500 index has outperformed the rest of the global equity market by a wide margin over the past five years.
- The currently high valuation and concentration risk in the S&P 500 index has prompted many market experts to suggest that the US large cap market is at risk of a correction.
- While the US large cap market has been a high side performance outlier over the last five years, the foreign developed smid cap growth market has been the low side performance outlier.
- Foreign smid cap growth stocks trade at a 29% price-earnings multiple premium to US large caps on average over time. They currently trade at a 6% discount.
- The last time foreign smid cap growth traded at a similar discount to US large cap was in 2003.
- Between 2003 and 2006, foreign smid cap growth stocks outperformed US large caps by approximately 115% on a cumulative basis.
- We believe the current valuation differential between foreign smid cap growth stocks and US large caps presents a rare and very attractive opportunity for investors.
Tipping Point
The S&P 500 Index[1] delivered a second consecutive +20% calendar year return in 2024. It is only the third time since 1957 that it has happened. The first and second instances were technically a five-year stretch of +20% year returns between 1995-1999, when the Index delivered an annualized return of 28.56% (+251.12% cumulative return)[2]. It was a very good time to be an investor in the US equity markets on an absolute and relative basis. The MSCI ACWI ex USA IMI Index[3], which includes foreign and emerging market small to large cap stocks, produced an annualized return of +11.27% (+70.56% cumulative return) over the same five-year period, trailing the S&P 500 Index by a wide margin.
The last five years, apart from 2022, have felt like the late 1990s in relative terms. During this period, the S&P 500 Index has delivered a +14.53% annualized return (+97.02% cumulative return)[4]. That includes 2022, when the index was down -18.11%. The ACWI ex USA IMI Index delivered a meager +4.62% annualized return (+25.36% cumulative return) over the same period. From a valuation standpoint, S&P 500 Index 3-year cyclically adjusted price to earnings multiple[5] (i.e., current price divided by the 3-year average annual earnings) ended the year at 28x. While the Index’s current valuation is not as high as it was at the end of 1999, when it hit its 67-year record high at 34.4x, it is still very high relative to its historical valuation range and has prompted many market prognosticators to start using words like “frothy” and even “bubble” when discussing the current state of the US equity market. See Exhibit 1.
Exhibit 1
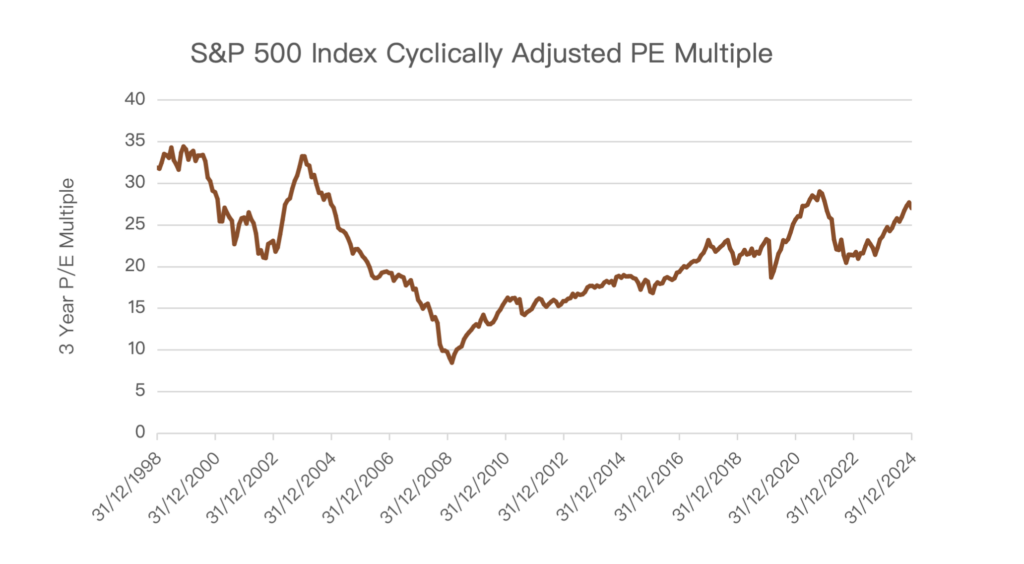
Source: MSCI, Factset, December 31, 2024
What have been the catalysts that have led the US market to outperform this time? Fundamentally, earnings growth in the US has been higher over the last five years than it has been in the rest of the world. However, we must acknowledge that at least part of this should be attributed to a dramatic increase in real US household net worth during the period. According to a study by economists at the San Francisco Fed[6], real household net worth increased by $17 trillion between the beginning of 2020 and the end of 2021. They estimate the figure rose by $13 trillion more than it would have without Covid and government economic stimulus that followed. The study has also estimated that real household net worth has rapidly decreased since the end of 2021, back to where it was projected to be without the pandemic’s impact. Looking forward, investors must determine if the high valuation that US equities now command is justified given the earnings growth will not be fueled, at least in part, by elevated household net worth.
Another factor that we believe has contributed to the US equity market’s outperformance has been investor flows. In 2024 alone, there were over $397 billion in net inflows into US large cap blend funds, an all-time high. It exceeded the annual record set the previous year at $194 billion. Over the past 4 years, US large cap blend funds have taken in more than $909 billion, which is $269 billion more than the total invested in the previous 10 years before that. See Exhibit 2.
Exhibit 2
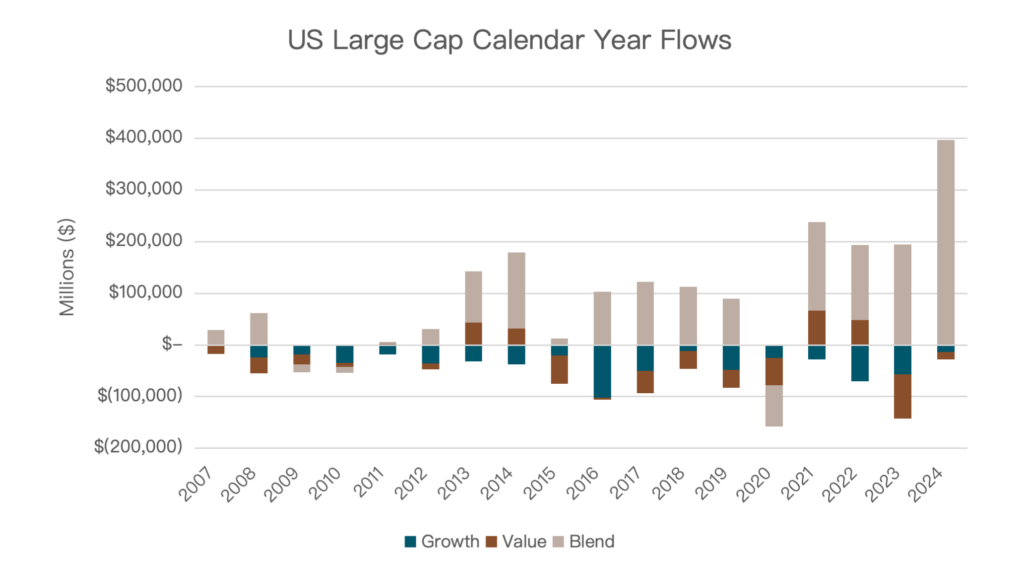
Source: Morningstar Direct, December 31, 2024
While the magnitude of returns and valuation of the S&P 500 Index are comparable between 1995-99 and 2019-24, there is one stark difference. The concentration risk is much higher in the Index today. In 1999, the top five stocks represented only 16.60% of the Index. On the other hand, the top five stocks represented 28.80% of the Index as of year-end. The last time the top five stocks represent over 25% of the index was in 1965[7]. The high concentration coupled with the relatively high valuation suggests that the US large cap market may be more susceptible to a correction than it was in 1999, giving some legitimacy to those who have put the US market on bubble watch.
While the US large cap market has been the high side performance outlier over the past five years, the low side performance outlier has been the foreign developed market small-mid (smid) cap growth stocks, which have generated a disappointing annualized return of +2.46% over the period[8]. The price performance differential between US large caps and foreign smid cap growth, coupled with a much lower differential in earnings growth, has produced a very large disparity in the valuations. See Exhibit 3.
Exhibit 3

Source: Factset, December 31, 2024
Foreign smid cap growth stocks have historically traded at an average price-earnings multiple premium of +29% versus US large caps but currently trade at a -6% discount. In the last 30 years, the only other period when foreign smid cap growth stocks offered this much relative value was in early 2003, when they traded at nearly a -10% discount to US large caps.
Like US large caps, investor flows may have also been a major influence in the current valuation for foreign smid cap growth stocks. There have been significant outflows from the Morningstar Global Small-Mid Fund category over the past three years and the outflows have been concentrated in Foreign smid growth funds. See Exhibit 4.
Exhibit 4
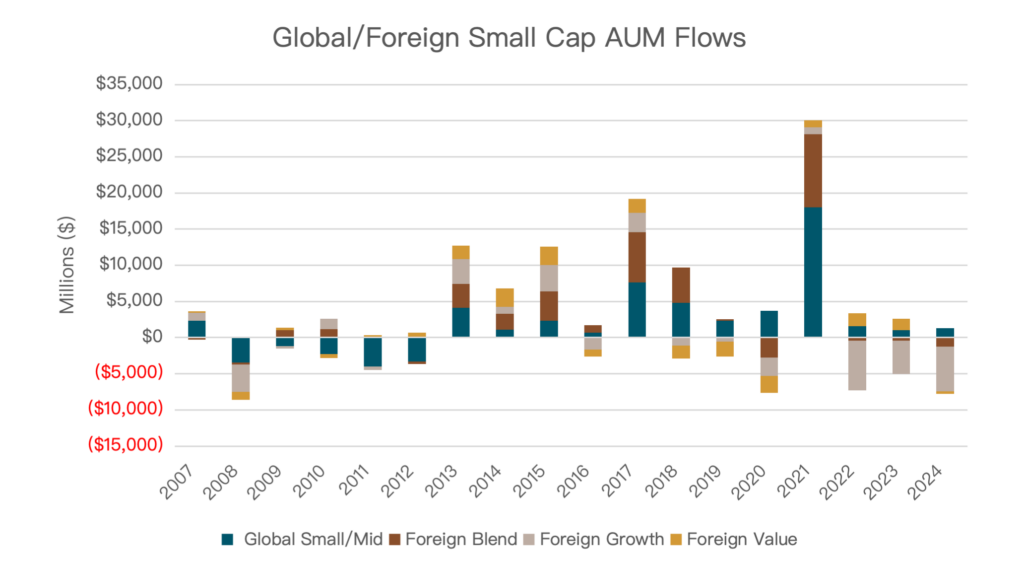
Source: Morningstar Direct, December 31, 2024
We believe the current valuation differential between foreign smid cap growth stocks and US large caps presents a rare and very attractive opportunity for investors. At some point, we believe there will be a tipping point where public market investors collectively appreciate the dislocation in valuations and shift flows in favor of foreign smid cap stocks, restoring the premium they typically command. While we do not know when we will reach that tipping point, we are seeing evidence that it may be close. The Financial Times reported earlier this month that “private equity groups ramped up [investment] activity last year, taking advantage of the continent’s economic woes to snap up big companies at depressed valuations.”[9] At some point, public equity investors are likely to follow suit.
The last time foreign small cap growth stocks were trading at a discount to US large caps, and we reached a tipping point, in May of 2003, it only took 18 months for the +29% average premium to be restored. In that case, from 2003 to 2006, the -10% discount surged to an 80% premium and foreign small cap growth stocks outperformed by +114.94% on a cumulative basis.[10] Investors who recognized the valuation disparity then and adjusted their allocations in advance of the tipping point were rewarded handsomely. We believe the same may be true for investors who exercise the same investment discipline this time around.
Exhibit 5
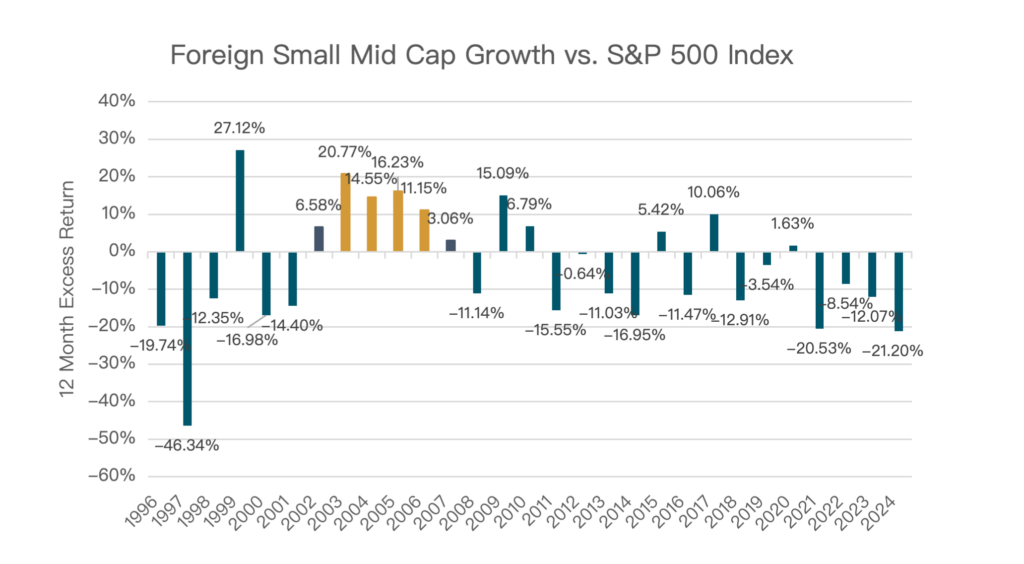
Source: MSCI, Factset, December 31,2024
Portfolio Commentary
In the 4th quarter, most of the Grandeur Peak growth funds disappointingly underperformed their benchmarks and peers. The reason for our underperformance was largely due to overweights in Western European countries including the United Kingdom, Sweden, Belgium, and France, which all underperformed in the quarter.
Our portfolio commentary typically goes through sectors and geographies to highlight what worked and what didn’t over the quarter. This quarter, in a break from our normal format, we’ve asked several of our lead analysts to provide you with specific insight into some of our largest weight and highest conviction holdings (most of which are in these underperforming Western European countries). We hope you will see the opportunity and value that we see in these portfolio companies.
Virbac SA (VIRP FP)
Description: Virbac is a French animal health company that sells pharmaceuticals for pets (~60% of sales) and livestock (~40% of sales) across the globe[11]. We’ve been shareholders since early 2021 but have been aware of them for much longer. At least ten members of our team have met with them over the last four years.
Key Info: The animal health sector has been a goldmine of opportunity well before we even started Grandeur Peak. Over the past 10-15 years, it has produced a tremendous pedigree of successful investments. The humanization of pets is a powerful theme. It didn’t begin with COVID, and it didn’t end with COVID either. We still think there are decades of opportunity ahead. With each passing generation (from Gen X to Millennials to Gen Z and so on), people care more and more about their pets. The number of pets continues to increase and the lifespan for these pets continues to increase. Most importantly, people are spending more on their pets each year.
On the livestock side, economic development (population growth, rising middle classes in emerging countries, etc.) drives increased demand for protein consumption. As those demands increase, so does the pressure to improve livestock supply and productivity. There’s also a movement toward more ethical treatment of these animals.
All these dynamics (and more) drive growth for the overall animal health sector, where we’re well-connected and have a deep understanding of the global opportunity set.
We think Virbac is one of the best companies within this space. The business has been built brick by brick over the last 40+ years. The founding family still owns the majority of shares and remains heavily involved in managing the business. We appreciate their shareholder alignment and long-term mindset. And while the company is currently undergoing a CEO transition, we’re confident in the board and remaining management team. Perhaps more importantly, the business is in great shape. What we own (and what the next CEO will inherit) is a diversified and growing portfolio of unique products in niche markets. When it comes to the profile of these products, we like that they are generally small (i.e. not where the big companies are focused) and differentiated.
One of the most important aspects of our thesis is that Virbac has an opportunity to grow earnings meaningfully faster than sales. The company already produces very solid profitability levels today, but there’s even greater potential. So, we think it’s a very good business that’s getting better every year.
When we look at the stock price, we feel incredibly frustrated, but also excited. In 2024, Virbac’s stock was down ~17% in USD terms (in an environment where most of our benchmarks were up around 5-10%). This is despite Virbac growing earnings roughly 20% in the year. The stock took a hit after the Q3 results came it a bit soft. However, the year was about as fundamentally strong for Virbac as we ever could have hoped. While this has been very frustrating, we think the valuation is highly compelling in absolute and relative terms.
Relevant Statistics: Over the last 3-5 years, Virbac has compounded earnings in the mid-teens range. Over the next 3-5 years, we expect low teens growth rates (we think 12-13% is reasonable and hopefully conservative). We expect the company to generate healthy cash flows with strong and rising return on asset (ROA) levels, as they have done historically. We wouldn’t be surprised if 2025 proves a little softer than usual (though still solid) as the company digests an incredibly strong year in 2024.
Virbac’s stock currently trades at about 17-18x trailing twelve-month earnings. We think this is not only attractive in absolute terms but in relative terms as well. You may be aware that one of our long-time holdings (and largest positions), Dechra Pharmaceuticals (previously listed as DPH LN), was acquired last year by a consortium led by EQT SS[12] for nearly $6B USD. This roughly translated to a mid-to-high 30s price to earnings (P/E) multiple on trailing twelve-month earnings. In other words, about two times where Virbac trades today. And while we think there are reasons why Dechra deserved a higher multiple than Virbac, we think this provides just one data point to indicate how compelling Virbac’s stock looks at this time. Dechra was Virbac’s most comparable competitor and peer.
Melexis NV (MELE BB)
Description: Melexis is a Belgian semiconductor company that specializes in designing chips for the automotive sector[13]. Melexis benefits from the growing trends to digitize vehicles (safety sensors, infotainment, comfort), electrify vehicles (EVs), and enhance vehicles through advanced driver-assistance system (ADAS) capabilities.
We have followed the company since before the inception of Grandeur Peak, and our team has spoken with the management team and visited their offices in Ypres, Belgium, many times over the years.
Key Info: The automotive semiconductor industry is compelling because of the strong secular trends that will continue to play out over the coming decade. Connectivity, electrification, and automation – independently but especially concurrently – mean more specialized silicon per car in the years ahead. This trend isn’t a fad that started with the recent push toward EVs and autonomous driving—it has been gaining momentum for over a decade—and we believe the sector has many years of opportunity ahead.
Melexis is uniquely positioned within this opportunity set, as they focus on niche, high-value sensors, and driver integrated circuits (ICs) rather than commodity products – a claim supported by their consistently high margins. They aren’t reliant on the success of any single IC, as they have a broad portfolio. These chips play a key role in battery management, safety systems, lighting, and powertrain optimization. And with each new generation of vehicle, the semiconductor content per vehicle continues to rise, further boosting demand for Melexis’ products. Even in a world where auto volumes are flat, Melexis believes they will grow their automotive related revenue by more than a 10% compound annual growth rate (CAGR) from 2024-2030.
Importantly, the sales cycle in automotive is long and tough to break into. Melexis has a long-standing relationship with all major Tier 1 automotive suppliers and original equipment manufacturers (OEMs), which means its products are trusted and are deeply integrated into customer designs at a reasonably early stage in the development process. This in turn leads to a higher degree of stickiness and better visibility into the revenue pipeline.
Melexis has recently been under pressure, however, as the auto market is experiencing a slowdown, and auto manufacturers want to burn through their inventories. The company lowered guidance in their Q3 results to account for the slowdown. The stock was down roughly 40% in 2024, which is a massive overreaction according to our analysis. Such inventory corrections typically last a few quarters. In this specific case, we believe Melexis is working to get ahead of the correction, which will shorten the negative impact on the business fundamentals. The market doesn’t seem to expect a recovery for a few quarters though, which indicates that pulling out of this inventory correction in any shorter time frame should be upside to the stock in the near term. So, while the semiconductor industry is cyclical and Melexis isn’t spared from that cyclicality, we believe they benefit from secular growth trends which in due time overpower the cyclicality of the sector.
Beyond their auto exposure, we believe Melexis is an interesting and underappreciated beneficiary of robotics. Should we see humanoids and other robots become more mainstream as many industry leaders predict (Elon Musk, Jensen Huang, et al.), Melexis has over a dozen products to sell into robotics manufacturing. Even without mass adoption, Melexis believes this non-automotive business will grow at over a 15% CAGR from 2024-2030. Over time, this diverse exposure has the potential to reduce the impact of the auto market’s volatility.
Relevant Statistics: The financial profile of Melexis is as interesting as the underlying secular growth trends. The company delivers an ROA of 24%, a return on invested capital (ROIC) of 37%, and a return on equity (ROE) of 35%. They also recently approved a 50 million Euro share buy-back program, something they haven’t done since 2012, when the company traded for a similar multiple.
Melexis currently trades for a trailing price to earnings ratio (P/E) of 12.6x. Since 2015, the company has averaged a trailing PE of ~28x, a 123% premium to today’s multiple. To be clear, our thesis isn’t hinged on Melexis getting back to that average multiple. We model a healthy mid-teen annualized return over a five-year period without such an assumption; there is a nice margin of safety built in to the stock. At the same time, by most indications, Melexis is a higher quality company today than it’s ever been, and as such, we do think it is likely that as growth comes back online, the multiple will recover.
Diploma plc (DPLM LN)
Description: Diploma is a UK-based value-add industrial distributor focusing on the seals, life science, and controls markets[14]. They grow both organically and through consolidating their markets through acquisitions.
Key Info: The industrial distributor pedigree is among the best in the world. We’ve seen some of the largest industrial companies in the world like Fastenal and Grainger come out of this space. The average performance of industrial distributors around the world is as good as just about any other group of companies we track.
Diploma itself is a special company. They have a disciplined organic growth strategy, which they’ve managed to accelerate since the new CEO took over in 2019. Organic growth is king for our companies, and we believe is a sign of their quality. To achieve their accelerated organic growth, Diploma has tilted toward fast growing end markets, penetrated new geographies, and rolled out new products. Their end markets include renewable energy, data centers, electrification of society, aerospace and defense, and industrial automation.
Additionally, the company’s acquisition strategy and track record are very exciting. They’ve accelerated their acquisition growth to an average of 10-15% over the last five years. They have a robust team who internally sources targets in geographies where they either have no presence or a small presence. They have a clear roadmap on the products and geographies they’d like to expand into over the coming few decades. They have done 5-6 sizeable acquisitions over the last five years and each one of them has turned out exceptionally well. They have been able to augment organic growth and margins of the companies they acquire as they plug them into Diploma’s global sales platform and management structure. One of their acquisitions, Windy City Wires, has been a phenomenal success and is perhaps the best acquisition we’ve ever seen.
We also believe Diploma to be a governance leader. Their board takes the initiative to reach out to us every year to schedule a call to talk about their governance policies. We’ve seen them enact feedback from us and other shareholders on their governance policies, which are already best in class. We believe their management team to be among the highest quality. We’ve met with them over a dozen times in the last few years, both in our offices and at their sites in the UK.
Relevant Statistics: Diploma had a strong 2024 returning roughly 18.5%, but the stock is still a compelling hold within our Quality, Valuation, and Momentum (QVM) Framework. Diploma has driven strong margin expansion over time, with their operating margins going from 16% to 21% since the current CEO arrived. They have achieved an EPS CAGR of almost 20% over the same time period, including two capital raises for highly accretive acquisitions. Their balance sheet remains conservative, and we believe they have ample room to continue to acquire high quality companies around the world. We expect organic revenues to grow 10-15% in the coming years and earnings to growth a bit faster than that.
JTC plc (JTC LN)
Description: JTC is a UK-based administration provider to the funds, corporate, trust and private assets markets[15]. They provide a suite of administration services such as fund accounting, valuation, and shareholder registration. JTC has over 14,000 clients in real estate, debt, fintech and private equity spanning over a hundred countries.
Key Info: Four of the key areas we are focused on when analyzing a company are: 1) business model; 2) company/management quality; 3) sustainable competitive advantage; and 4) growth and headroom opportunity. JTC sits favorably across each of these dimensions. JTC has built, and continues to augment, a high-quality diversified administration platform that can service clients across an array of products, geographies and jurisdictions. This breadth combined with quality service makes JTC a provider of choice, and sometimes the only choice. Their revenues are largely all recurring and client retention sits near 100%. With thousands of clients across the globe, they don’t have meaningful customer, product, or geographic concentration. Much of the management team, including the CEO and CFO, have been in place since before the initial public offering (IPO) and are responsible for the company’s strategic direction and trajectory. JTC prides itself on an outstanding culture and has a shared ownership program where all employees are owners. While we view JTC as an exceptional company and operator, they also sit favorably in a market that benefits from several growth drivers. We love companies that are ‘swimming downstream’ and JTC benefits from five key trends: increased outsourcing, globalization, more regulatory scrutiny and complexity, privatization of assets, and rising wealth. In addition to these trends that lead to double digit organic growth, they also benefit from a consolidating industry, and they have an exceptional track record of adding value through acquisitions.
Relevant Statistics: We have owned JTC since its IPO in early 2018. Since that time, JTC has grown its revenue by 5x and its adjusted earnings before interest, tax, depreciation, and amortization (ebitda) by 7x. This has resulted in an 18% compounded return for us since the IPO. The company has plans to double the business again between 2024 and 2027. While we have made a nice return in JTC (+20% in 2024), we believe the company to be undervalued at a ~25x Grandeur Peak adjusted P/E ratio. This belief is supported by the company’s growth and profitability profile as well as private transactions of JTC’s closest competitors that have taken place at nearly double JTC’s current valuation. We believe that some of this discount is purely a function of a small cap growth market that is currently out of favor. If JTC delivers our expected mid/high teens earnings per share growth, the stock should continue to follow – while there is material upside should we get more normalized small cap growth valuations and/or the private takeout premium begins to be reflected.
JFrog Ltd (FROG US)
Description: JFrog is a US/Israel-based technology company that provides businesses with mission critical tools and solutions needed to deploy, operate, and secure their software supply-chain[16]. We have followed the company since their IPO in 2020.
Key Info: When in production, software programs are made up of packages called binaries. JFrog’s Artifactory product is the gold standard for binary management, providing companies with the ability to store and orchestrate these packages within their software supply-chain. JFrog dominates the binary management space, serving 83% of the Fortune 100, and recently announced a partnership with Microsoft’s GitHub[17] in response to customer demand for seamless integration between the two solutions. Leveraging their expertise in binary management, JFrog has created a comprehensive DevSecOps platform that integrates software development, security, and operations. The platform allows for complete ownership of the software supply-chain by offering advanced security and distribution tools alongside their robust binary management solutions.
Increased digitization, fueled by artificial intelligence and more prolific code generation, is driving an increase in binary packages that must be efficiently stored and managed, while more sophisticated and frequent cyber threats increase the need for security within the software supply-chain. Supported by its existing platform, JFrog is well positioned to capitalize on these trends and maintain their growth trajectory over the next decade. Recent announcements with GitHub, Nvidia, and HuggingFace[18] suggest potential upside as these partnerships gain traction over time.
JFrog’s founder-led management team has a balanced approach to growth and profitability. They exhibit a best-in-class financial profile for a high growth software company with 20%+ top line growth, robust gross margins, and strong free cash flow (FCF) generation. They also sit on a healthy balance sheet which they can invest back into the business and put to use in strategic merger and acquisition (M&A) opportunities. The stock was down 15% in 2024. In their Q2 release, management cut guidance for the second half of the year, which caused the share price to fall ~30%. We viewed this correction as incredibly short-sighted and took the opportunity to add to our position. Since then, the stock has rebounded ~30%.
Relevant Statistics:
- 20%+ revenue growth, 70%+ gross margin, average FCF margin of 13% since 2018, debt free balance sheet with $470m in cash.
- 83% of the Fortune 100 are customers.
- 95.7% of JFrog’s revenue is from multi-product deals.
- JFrog has 100% subscription revenue, meaning they should have highly predictable and stable income streams.
- JFrog has a Dollar-Based-Net-Retention Rate of 117%. A Dollar-Based-Net-Retention rate measures how much revenue you retain and expand within your existing customer base. A rate over 100% is healthy and indicates that upgrades are outweighing downgrades and churn.
We hope this added detail into some of our larger weight names helps provide some context when we express how excited we are about the quality and valuation of our portfolios. We believe these examples are reflective of the opportunity across all our strategies.
Notes from the Road
Company Touch Tracker
This quarter our team engaged with 412 companies across the world, putting our trailing 12-month company touches at 1,693.
This past quarter, team members traveled domestically to Pennsylvania, Texas, Arizona, Georgia, Illinois, California and New York. Internationally, team members traveled to Australia, China, Canada, India, Japan, United Kingdom, and Taiwan and interacted with companies in Hong Kong, Italy, Indonesia, Finland, Brazil, Switzerland, Luxembourg, Sweden and Malaysia.
Australia Recap
Matt Kaelberer, Research Analyst, Karson Schrader, Research Analyst, Mark Madsen, Research Analyst and Portfolio Manager, and Todd Matheny, Head of Client Relations traveled to Australia in December.
Mark, Todd, Karson, and I spent a week in Australia in December 2024. In typical Grandeur fashion, our team participated in 27 meetings over five days in four different cities, which didn’t leave a lot of downtime. The meeting schedule included a variety of companies with an emphasis on the Industrials, Mining and Financials sectors.
December is a great time to be in Australia as its high season for the “Aussie Summer.” The streets in Sydney were crowded with people, and the restaurants and bars seemed to overflow with energy. The city felt alive in a way I haven’t seen in many of the places I’ve traveled.
Australia is an easy place to visit culturally. As an American, I always feel at home. The people have a similar sense of humor and lifestyle as the US. The car radio stations play Classic Rock and American Country. Restaurants offer both familiar selections but also amazing exotic food options from all over the world. The grocery stores look like those in the US. Many Australians have spent time living in the US and follow US pop culture. As close political and military allies, our two countries have a very strong bond that I’m reminded of every time I go there. A strong US Dollar to Australian Dollar currently makes Australia a lot more affordable for Americans.
However, Australia has not been immune to the effects of inflation on consumers’ purchasing power. The Gross Domestic Product (GDP) growth was sluggish last year and is likely to remain tepid in 2025. Australia has always been an expensive place to live, and inflation of the last few years has made housing, and consumables feel even more expensive.
From an investment perspective, Australia is an exciting market for micro-small cap managers like us. While there are more people living in Delhi, India than in all of Australia, its geographic size is nearly as big as the continental United States. Australia’s isolation from the rest of the world has influenced its number of home-grown companies. It is often easier to develop your own company than rely on imports of foreign companies. This creates an interesting dynamic where we can find mini versions of large, global companies operating exclusively in Australia. As we connect global dots, we can find intriguing investment opportunities by watching these smaller Australian companies follow a similar playbook as their larger global peers. We’ve also identified a few local companies which have expanded far beyond Australia and become the global leader in their industries, which can create an exciting investment opportunity as well.
We began our trip In Perth, a city known for its ties to the mining industry. While we don’t own many direct mining companies, we do own several asset-light mining services players which can experience cyclical market forces similar to the asset-heavy miners. Like other Industrial markets, the Mining industry has suffered the last year or two. Commodity prices skyrocketed during the post-Covid supply chain issues and heavy industrial growth of 2021-2022. Now these companies are lapping tougher comparables, suffering from wage and equipment inflation, and facing slower end-market demand. The management teams were bearish on the potential results for the first half of 2025 but have growing confidence that things could turn towards the end of the year. One leading indicator mentioned was that smaller mining companies have started to be acquired which is generally a sign that the mining cycle is strengthening. We identified a surprisingly large number of mining services companies with solid returns on capital and growth profiles. While we don’t expect these companies to ever be a large part of our portfolios, we can see where we might own a small weight spread across a number of players.
In Sydney and Melbourne, we met with several financial services companies. The Financial Services sector in Australia is largely driven by the Superannuation rules imposed by the government. By law, every working citizen of Australia must contribute a certain percentage of their income to their retirement funds each year. Many of the managers and advice providers for those funds are publicly traded and have ridden this wave the last few decades. Given the program started in the 90’s, we’re now starting to see the first workers with well-funded accounts retire. Over the next decade, we anticipate that number could increase dramatically as the retirement population grows. We believe this flood of retirees will drive the need for both investment advice and investment income over time.
Private credit is emerging as one of the natural solutions to address the need for income-generating investments. Similar to trends in the US, Australian banking regulators have continually pushed banks to simplify balance sheets and be more conservative generally. Private credit managers have stepped in to fill the needs regulators have created. The Australian private credit market is not exactly like the US, which is largely driven by direct corporate lending. The Australian private credit market is largely focused on the asset-backed space like real estate. The industry is still nascent but is expected to grow significantly and the local players are hoping to position themselves to fill the future demand. Our visits included the leading private credit managers in the country, and they uniformly expressed confidence in the potential market opportunity of the space. We believe the fundamentals and growth trajectory of both the advice providers and the private credit companies may provide an attractive long-term investment opportunity.
Given our investment strategy of finding high quality, micro-to mid-cap companies with healthy earnings growth potential, a visit to Australia every 12 to 18 months can be meaningful and productive. Australia is a wonderful place to visit, and we’ve generated a nice list of actionable tasks for both our current portfolio holdings and potential new ideas.
Business Update
We are pleased to announce the temporary re-opening of the Grandeur Peak Funds, including the Grandeur Peak Global Opportunities Fund (GPGOX/GPGIX), Grandeur Peak International Opportunities Fund (GPIOX/GPIIX), Grandeur Peak Emerging Markets Opportunities Fund (GPEOX/GPEIX), Grandeur Peak Global Reach Fund (GPROX/GPRIX), Grandeur Peak Micro Cap Fund (GPMCX), and the Grandeur Peak International Stalwarts Fund (GISOX/GISXY). We look to reopen our funds for the benefit of investors when the market gives us a compelling investment opportunity and we have the capacity to take on additional assets. You may remember us doing so for a few months in early 2020 after the sharp market pullback brought on by the Covid-19 pandemic. Additionally, we are big believers in “eating our own cooking,” so Grandeur Peak has recently added more of our balance sheet capital into our Funds.
Also, while we could never expect to consistently outperform over short timeframes, we do feel like a three-year window is typically enough time to overcome spurious short-term headwinds and weather a small-cap cycle. Unfortunately, our growth funds have failed to do so. We know you, our clients, have been remarkably patient, perhaps more so than we deserved. As we shared earlier in the letter, we feel current valuation for our out-of-favor space is particularly compelling considering the large disparity between foreign small cap growth and US large caps. As a demonstration of our gratitude and in acknowledgment that we haven’t lived up to our own expectations, we are applying a modest fee waiver to our small- and mid-cap growth funds for the full 2025 calendar year.
Funds with a 10-basis point waiver[19]:
- Emerging Markets Opportunities
- Global Explorer
- Global Opportunities
- Global Reach
- International Opportunities
Funds with a 5-basis point waiver:
- Global Stalwarts
- International Stalwarts
- US Stalwarts
With the new year, we have also made a couple of changes to the portfolio management of our funds. Juliette Douglass has been added as a Co-Portfolio Manager (PM) of the Grandeur Peak Emerging Markets Opportunities Fund with Blake Walker. Juliette will remain as a PM of the International Opportunities Fund and the Global Reach Fund. Also, Ben Gardiner has been added as a PM of the Grandeur Peak Global Reach Fund, as part of the Health Care team. Ben will remain as Co-PM with Blake Walker of the Global Opportunities Fund. Portfolio Managers continuing to lead the Global Reach Fund include Brad Barth, Liping Cai, Tyler Glauser, Mark Madsen, Phil Naylor, and Amy Sunderland.
We are pleased to announce the addition of Nick Luong, CFA®, Senior Research Analyst to the Research Team. Nick brings over six years of experience to the Grandeur team, having covered names in the Health Care and Financials sector as a SMid-cap analyst at Seven Canyons Advisors most recently. He has also worked as a sovereign research analyst at Thrivent Mutual Funds. He completed a Masters in Business Administration from the University of Chicago Booth School of Business and is a CFA charterholder. As a part of his role at Grandeur, Nick will be covering India, Southeast Asia and other Emerging Markets.
As always, please feel free to reach out any time with any questions, requests, or comments. We appreciate the opportunity to work on your behalf.
Sincerely,
Todd Matheny, CAIA®
Jesse Pricer, CFA®
Amy Johnson, CFP®
The Grandeur Peak Client Team
Total Returns | As of December 31, 2024
| CUMULATIVE | ANNUALIZED | |||||||
| QTR | YTD | 1 YR | 3 YR | 5 YR | 10 YR | SINCE FUND INCEPTION | ||
| Global Contrarian, Institutional Class (GPGCX) | 0.82% | 14.93% | 14.93% | 5.98% | 12.28% | n/a | 13.53% | |
| MSCI ACWI IMI Index[I] | -1.14% | 16.89% | 16.89% | 5.41% | 10.18% | n/a | 11.22% | |
| MSCI ACWI Small Cap Index[II] | -3.17% | 8.15% | 8.15% | 1.24% | 7.16% | n/a | 8.34% | |
| MSCI ACWI ex USA Small Cap Index[III] | -7.59% | 3.85% | 3.85% | -0.98% | 4.77% | n/a | 6.47% | |
| Global Explorer, Institutional Class (GPGEX) | -5.17% | -0.85% | -0.85% | -7.40% | n/a | n/a | -6.61% | |
| MSCI ACWI IMI Index | -1.14% | 16.89% | 16.89% | 5.41% | n/a | n/a | 6.07% | |
| MSCI ACWI Small Cap Index | -3.17% | 8.15% | 8.15% | 1.24% | n/a | n/a | 2.40% | |
| Global Micro Cap, Institutional Class (GPMCX) | -6.03% | 3.22% | 3.22% | -7.43% | 7.28% | n/a | 8.40% | |
| MSCI ACWI IMI Index | -1.14% | 16.89% | 16.89% | 5.41% | 10.18% | n/a | 10.48% | |
| MSCI World Micro Cap Index[IV] | -1.71% | 6.13% | 6.13% | -4.05% | 4.88% | n/a | 6.67% | |
| MSCI ACWI Small Cap Index | -3.17% | 8.15% | 8.15% | 1.24% | 7.16% | n/a | 8.35% | |
| Global Opportunities, Investor Class (GPGOX) | -8.15% | -10.11% | -10.11% | -11.45% | 4.06% | 6.51% | 9.70% | |
| Global Opportunities, Institutional Class (GPGIX) | -8.15% | -10.05% | -10.05% | -11.26% | 4.33% | 6.76% | 9.99% | |
| MSCI ACWI IMI Index | -1.14% | 16.89% | 16.89% | 5.41% | 10.18% | 9.55% | 10.66% | |
| MSCI ACWI Small Cap Index | -3.17% | 8.15% | 8.15% | 1.24% | 7.16% | 7.74% | 9.55% | |
| Global Reach, Investor Class (GPROX) | -5.00% | -0.91% | -0.91% | -9.34% | 4.72% | 6.70% | 8.16% | |
| Global Reach, Institutional Class (GPRIX) | -4.93% | -0.65% | -0.65% | -9.12% | 4.98% | 6.97% | 8.41% | |
| MSCI ACWI IMI Index | -1.14% | 16.89% | 16.89% | 5.41% | 10.18% | 9.55% | 9.83% | |
| MSCI ACWI Small Cap Index | -3.17% | 8.15% | 8.15% | 1.24% | 7.16% | 7.74% | 8.24% | |
| Global Stalwarts, Investor Class (GGSOX) | -5.06% | -4.60% | -4.60% | -12.32% | 2.78% | n/a | 7.26% | |
| Global Stalwarts, Institutional Class (GGSYX) | -5.04% | -4.36% | -4.36% | -12.09% | 3.05% | n/a | 7.53% | |
| MSCI ACWI IMI Index | -1.14% | 16.89% | 16.89% | 5.41% | 10.18% | n/a | 10.93% | |
| MSCI ACWI Mid Cap Index[V] | -3.36% | 10.01% | 10.01% | 1.35% | 7.06% | n/a | 8.53% | |
| MSCI ACWI Small Cap Index | -3.17% | 8.15% | 8.15% | 1.24% | 7.16% | n./a | 8.69% | |
| Intl Opportunities, Investor Class (GPIOX) | -10.88% | -11.64% | -11.64% | -13.61% | 0.87% | 4.35% | 7.72% | |
| Intl Opportunities, Institutional Class (GPIIX) | -10.73% | -11.48% | -11.48% | -13.40% | 1.12% | 4.58% | 7.96% | |
| MSCI ACWI ex USA IMI Index | -7.52% | 5.78% | 5.78% | 1.02% | 4.62% | 5.41% | 6.06% | |
| MSCI ACWI ex USA Small Cap Index | -7.59% | 3.85% | 3.85% | -0.98% | 4.77% | 6.10% | 6.75% | |
| Intl Stalwarts, Investor Class (GISOX) | -9.80% | -10.00% | -10.00% | -13.67% | 2.03% | n/a | 6.83% | |
| Intl Stalwarts, Institutional Class (GISYX) | -9.74% | -9.79% | -9.79% | -13.46% | 2.28% | n/a | 7.09% | |
| MSCI ACWI ex USA IMI Index[VI] | -7.52% | 5.78% | 5.78% | 1.02% | 4.62% | n/a | 6.45% | |
| MSCI ACWI ex USA Mid Cap Index[VII] | -7.34% | 4.11% | 4.11% | -0.46% | 3.42% | n/a | 5.78% | |
| MSCI ACWI ex USA Small Cap Index | -7.59% | 3.85% | 3.85% | -0.98% | 4.77% | n/a | 6.70% | |
| EM Opportunities, Investor Class (GPEOX) | -9.21% | -8.93% | -8.93% | -8.42% | 1.78% | 3.29% | 3.72% | |
| EM Opportunities, Institutional Class (GPEIX) | -9.11% | -8.62% | -8.62% | -8.17% | 2.03% | 3.53% | 3.96% | |
| MSCI Emerging Markets IMI Index[VIII] | -7.73% | 7.62% | 7.62% | -0.95% | 2.93% | 4.30% | 3.87% | |
| MSCI Emerging Markets SMID Index[IX] | -8.00% | 3.61% | 3.61% | 0.94% | 5.88% | 4.82% | 4.46% | |
| US Stalwarts, Institutional Class (GUSYX) | 1.96% | 5.63% | 5.63% | -5.87% | n/a | n/a | 16.46% | |
| MSCI USA IMI Index[X] | 2.62% | 23.82% | 23.82% | 8.08% | n/a | n/a | 22.37% | |
| MSCI USA Mid Cap Index[XI] | 0.02% | 15.26% | 15.26% | 2.83% | n/a | n/a | 20.47% | |
| MSCI USA Small Cap Index[XII] | 0.91% | 12.04% | 12.04% | 3.20% | n/a | n/a | 21.01% | |
An investor should consider investment objectives, risks, charges, and expenses carefully before investing. To obtain a Grandeur Peak Funds prospectus, containing this and other information, visit www.grandeurpeakglobal.com or call 1-855-377-PEAK (7325). Please read it carefully before investing.
The performance data quoted represents past performance. Current performance may be lower or higher than the data quoted above. Past performance is no guarantee of future results. The investment return and principal value of an investment will fluctuate so that investor’s shares, when redeemed, may be worth more or less than their original cost. For performance information current to the most recent month-end, please call 1-855-377-PEAK (7325).
The Advisor may absorb certain Fund expenses, without which total return would have been lower. Net Expense Ratio reflect the expense waiver, if any, contractually agreed to through September 1, 2025. A 2% redemption fee will be deducted on fund shares held 60 days or less. Performance data does not reflect this redemption fee or taxes.
| TOTAL EXPENSE RATIOS & INCEPTION DATES | |||||||||
| Inception Date | INVESTOR | INSTITUTIONAL | |||||||
| Fund | Gross | Net | Gross | Net | |||||
| Global Contrarian (GPGCX) | 09/17/2019 | 1.35% | 1.35% | ||||||
| Global Explorer (GPGEX) | 12/16/2021 | 3.14% | 1.25% | ||||||
| Global Micro Cap (GPMCX) | 10/20/2015 | 2.01% | 2.00% | ||||||
| Global Opportunities (GPGOX/GPGIX) | 10/17/2011 | 1.63% | 1.58% | 1.38% | 1.33% | ||||
| Global Reach (GPROX/GPRIX) | 06/19/2013 | 1.50% | 1.50% | 1.25% | 1.25% | ||||
| Global Stalwarts (GGSOX/GGSYX) | 09/01/2015 | 1.27% | 1.27% | 1.03% | 1.03% | ||||
| International Opportunities (GPIOX/GPIIX) | 10/17/2011 | 1.64% | 1.61% | 1.39% | 1.36% | ||||
| International Stalwarts (GISOX/GISYX) | 09/01/2015 | 1.17% | 1.17% | 0.92% | 0.92% | ||||
| Emerging Markets (GEPOX/GPEIX) | 12/16/2013 | 1.83% | 1.81% | 1.58% | 1.56% | ||||
| US Stalwarts (GUSYX) | 03/19/2020 | 0.90% | 0.90% | ||||||
There is no assurance that these opinions or forecasts will come to pass, and past performance is no assurance of future results.
RISKS: Investing in small and micro-cap funds will be more volatile and loss of principal could be greater than investing in large cap or more diversified funds. Investing in foreign securities entails special risks, such as currency fluctuations and political uncertainties, which are described in more detail in the prospectus. Investments in emerging markets are subject to the same risks as other foreign securities and may be subject to greater risks than investments in foreign countries with more established economies and securities markets. Diversification does not eliminate the risk of experiencing investment loss.
A Fund’s direct or indirect investments in foreign securities, including depositary receipts, involve risks not associated with investing in U.S. securities that can adversely affect the Fund’s performance. Foreign markets, particularly emerging markets, may be less liquid, more volatile, and subject to less government supervision than domestic markets.
The adviser’s judgments about the growth, value or potential appreciation of an investment may prove to be incorrect or fail to have the intended results, which could adversely impact the Fund’s performance and cause it to underperform relative to other funds with similar investment goals or relative to its benchmark, or not to achieve its investment goal.
[1] The S&P 500 Index is a stock market index tracking the stock performance of 500 of the largest companies listed on stock exchanges in the United States.
[2] Performance for the period 1/1/1995 – 12/31/1999.
[3] The MSCI ACWI ex USA IMI Index is designed to measure the equity market performance of large, mid, and small cap companies across developed and emerging markets globally, excluding the United States.
[4] Performance for the period 12/31/2019-12/31/2024.
[5] P/E Multiple is a valuation metric used to evaluate a company’s stock and is calculated by the ratio of Price to Earnings, or the price of a share of stock over the earnings per share.
[6] https://www.frbsf.org/research-and-insights/publications/economic-letter/2024/02/rise-and-fall-pandemic-excess-wealth/
[7] Source: S&P, Dow Jones, Bloomberg, Bianco Research.com
[8] Performance for the period12/31/2019-12/31/2024.
[9] “Private Equity Targets Europe for Big Buyout Deals,” Jan 11, 2025, Financial Times, https://www.ft.com/content/ec9aa2ae-f56a-4373-8c4b-88effc01a25d
[10] Performance for the period 12/31/2002-12/31/2006
[11] As of December 31, 2024, the Grandeur Peak Funds held 136,338 shares in Virbac SA.
[12] As of December 31, 2024, the Grandeur Peak Funds held 290,494 shares of EQT SS.
[13] As of December 31, 2024, the Grandeur Peak Funds held 690,610 shares of Melexis NV.
[14] As of December 31, 2024, the Grandeur Peak Funds held 939,427 shares of Diploma plc, 0 shares of Fastenal Company, and 1,265 shares of W.W. Grainger, Inc.
[15] As of December 31, 2024, the Grandeur Peak Funds held 3,706,353 shares of JTC plc.
[16] As of December 31, 2024, the Grandeur Peak Funds held 1,478,154 shares of JFrog Ltd.
[17] As of December 31, 2024, the Grandeur Peak Funds held 0 shares of GitHub.
[18] As of December 31, 2024, the Grandeur Peak Funds hold 0 shares of Nvidia Corp and 0 shares of Hugging Face, Inc.
[19] A basis point is 1/100th of a percentage point.
[I] The MSCI ACWI IMI Index is designed to measure the equity market performance of large, mid, and small-cap companies across developed and emerging markets globally.
[II] The MSCI ACWI Small Cap Index is designed to measure the equity market performance of small-cap companies across developed and emerging markets globally.
[III] The MSCI ACWI ex USA Small Cap Index is designed to measure the equity market performance of small cap companies across developed and emerging markets globally, excluding the United States.
[IV] The MSCI World Micro Cap Index is designed to measure the equity market performance of micro-cap companies across developed markets globally. It does not include emerging markets.
[V] The MSCI ACWI Mid Cap Index is designed to measure the equity market performance of mid-cap companies across developed and emerging markets globally.
[VI] The MSCI ACWI ex USA IMI Index is designed to measure the equity market performance of large, mid, and small cap companies across developed and emerging markets globally, excluding the United States.
[VII] The MSCI ACWI ex USA Mid Cap Index is designed to measure the equity market performance of mid cap companies across developed and emerging markets globally, excluding the United States.
[VIII] The MSCI Emerging Markets IMI Index is designed to measure the equity market performance of large, mid, and small-cap companies across emerging markets.
[IX] The MSCI Emerging Markets SMID Cap Index is designed to measure the equity market performance of small and mid-cap companies across emerging markets.
[X] The MSCI USA IMI Index is designed to measure the performance of the large, mid, and small-cap segments of the US market. With 2,327 constituents, the index covers approximately 99% of the free float-adjusted market capitalization in the US.
[XI] The MSCI USA Mid-Cap Index is designed to measure the performance of the mid cap segments of the US market. With 340 constituents, the index covers approximately 15 percent of the free float-adjusted market capitalization in the US.
[XII] The MSCI USA Small Cap Index is designed to measure the performance of the small cap segment of the US equity market. With 1,781 constituents, the index represents approximately 14 percent of the free float-adjusted market capitalization in the US.
[XIII] The S&P 500 Index is a market-capitalization-weighted index of 500 leading publicly traded companies in the U.S.
[XIV] The MSCI Emerging Markets Index is designed to measure the equity market performance of large and mid-cap companies across emerging markets.
[XV] The MSCI USA Index is designed to measure the equity market performance of large and mid-cap companies in the U.S.
[XVI] The MSCI ACWI ex USA Index is designed to measure the equity market performance of large and mid-cap companies across developed and emerging markets globally, excluding the United States.
[XVII] The MSCI World ex USA Index is designed to measure the equity market performance of large and mid-cap companies across developed markets globally, excluding the United States.
[XVIII] The MSCI Emerging Markets Small Cap Index is designed to measure the equity market performance of small cap companies across emerging markets.
| GLOBAL CONTRARIAN TOP 10 HOLDINGS As of 10/31/2024 | |
| % of Net Assets* | |
| Plover Bay Tech | 6.3% |
| Riverstone Holdings Ltd. | 4.7% |
| Petershill Partners PLC | 4.1% |
| Tethys Oil AB | 3.1% |
| P10 Inc | 2.1% |
| BayCurrent Consulting, Inc. | 1.9% |
| Rise Consulting Group Inc | 1.8% |
| Vietnam Technological & Comm Joint-Stock Bank | 1.8% |
| Five Below, Inc. | 1.7% |
| CVS Group plc | 1.6% |
| Total | 29.1% |
| GLOBAL EXPLORER TOP 10 HOLDINGS As of 10/31/2024 | |
| % of Net Assets* | |
| JTC plc | 1.1% |
| ULS Group Inc | 1.0% |
| Virbac SA | 1.0% |
| B & M European Value Retail SA | 0.9% |
| Silergy Corp | 0.9% |
| P10 Inc | 0.8% |
| Five Below, Inc. | 0.8% |
| Globant S.A. | 0.8% |
| Beenos Inc. | 0.8% |
| Sporton International, Inc. | 0.8% |
| Total | 8.9% |
| GLOBAL MICRO CAP TOP 10 HOLDINGS As of 10/31/2024 | |
| % of Net Assets* | |
| Pennant Group, Inc. (The) | 4.2% |
| Fiducian Group Ltd | 2.8% |
| Beenos Inc | 2.7% |
| ULS Group Inc | 2.6% |
| Yatharth Hospital | 2.4% |
| Kogan.com Ltd | 2.2% |
| Plover Bay Tech | 2.1% |
| Swedencare AB | 2.1% |
| Barrett Business Services, Inc. | 2.1% |
| Elixirr International PLC | 2.1% |
| Total | 25.3% |
| GLOBAL OPPORTUNITIES TOP 10 HOLDINGS As of 10/31/2024 | |
| % of Net Assets* | |
| B & M European Value Retail SA | 3.3% |
| BayCurrent Consulting, Inc. | 2.7% |
| Virbac SA | 2.7% |
| Littelfuse, Inc. | 2.6% |
| CVS Group plc | 1.7% |
| Volution Group PLC | 1.6% |
| JTC plc | 1.5% |
| Silergy Corp | 1.5% |
| Diploma plc | 1.3% |
| Melexis NV | 1.3% |
| Total | 20.0% |
| GLOBAL REACH TOP 10 HOLDINGS As of 10/31/2024 | |
| % of Net Assets* | |
| BayCurrent Consulting, Inc. | 1.7% |
| Plover Bay Tech | 1.5% |
| B & M European Value Retail SA | 1.1% |
| Virbac SA | 1.1% |
| JTC plc | 1.1% |
| Perella Weinberg Partners | 1.1% |
| Silergy Corp | 1.1% |
| Globant S.A. | 0.9% |
| CVS Group plc | 0.9% |
| Ace Hardware Indonesia Tbk PT | 0.9% |
| Total | 11.5% |
| GLOBAL STALWARTS TOP 10 HOLDINGS As of 10/31/2024 | |
| % of Net Assets* | |
| Silergy Corp | 3.3% |
| BayCurrent Consulting, Inc | 3.1% |
| B & M European Value Retail SA | 3.1% |
| Littelfuse, Inc. | 2.8% |
| Globant S.A. | 1.8% |
| JTC plc | 1.6% |
| Lululemon Athletica, Inc. | 1.5% |
| .Techtronic Industries Co Limited | 1.4% |
| Virbac SA | 1.3% |
| .Silicon Laboratories, Inc. | 1.2% |
| Total | 21.2% |
| INTERNATIONAL OPPORTUNITIES TOP 10 HOLDINGS As of 10/31/2024 | |
| % of Net Assets* | |
| B & M European Value Retail SA | 3.0% |
| JTC plc | 2.7% |
| Silergy Corp | 2.6% |
| BayCurrent Consulting, Inc. | 2.6% |
| Virbac SA | 2.0% |
| Volution Group PLC | 2.0% |
| Sporton International, Inc. | 1.7% |
| CVS Group plc | 1.7% |
| Integral Corp | 1.6% |
| Interpump Group SpA | 1.4% |
| Total | 21.4% |
| INTERNATIONAL STALWARTS TOP 10 HOLDINGS As of 10/31/2024 | |
| % of Net Assets* | |
| B & M European Value Retail SA | 4.2% |
| BayCurrent Consulting, Inc. | 3.6% |
| Silergy Corp | 3.6% |
| Diploma plc | 2.3% |
| Techtronic Industries Co Limited | 2.1% |
| JFrog Ltd. | 2.0% |
| Lululemon Athletica, Inc. | 1.9% |
| Melexis NV | 1.8% |
| Globant S.A. | 1.8% |
| Interpump Group SpA | 1.7% |
| Total | 24.9% |
| EMERGING MARKETS OPPORTUNITIES TOP 10 HOLDINGS As of 10/31/2024 | |
| % of Net Assets* | |
| Silergy Corp | 4.3% |
| 2.6% | |
| Sporton International, Inc. | 2.4% |
| FPT Corp | 2.3% |
| Sinbon Electronics Co., Limited | 2.3% |
| Globant S.A. | 2.2% |
| SJS Enterprises Ltd | 2.2% |
| Plover Bay Tech | 2.2% |
| Regional SAB de cv | 1.9% |
| iFast Corporation | 1.8% |
| Total | 24.1% |
| US STALWARTS TOP 10 HOLDINGS As of 10/31/2024 | |
| % of Net Assets* | |
| Littelfuse, Inc. | 2.9% |
| Lululemon Athletica, Inc. | 2.3% |
| Silicon Laboratories, Inc. | 2.0% |
| JFrog Ltd. | 1.9% |
| Techtronic Industries Co Limited | 1.9% |
| Globant S.A. | 1.9% |
| Ares Management Corporation | 1.9% |
| Herc Holdings, Inc. | 1.8% |
| Goosehead Insurance, Inc. | 1.8% |
| Primoris Services Corporation | 1.7% |
| Total | 20.2% |
*Holdings are subject to change and do not constitute a recommendation or solicitation to buy or sell a particular security. Current and future holdings are subject to risk. Total amount subject to rounding.
CFA® is a trademark owned by CFA Institute. The Chartered Financial Analyst (CFA) designation is issued by the CFA Institute. Candidates must meet one of the following prerequisites: undergraduate degree and 4 years of professional experience involving investment decision-making, or 4 years qualified work experience (full time, but not necessarily investment related). Candidates are then required to undertake extensive self-study programs (250 hours of study for each of the 3 levels) and pass examinations for all 3 levels.
Grandeur Peak Funds are distributed by Northern Lights Distributors, LLC, Member FINRA/SIPC. Todd Matheny, Jesse Pricer and Amy Johnson are registered representatives with Northern Lights Distributors, LLC, which is not affiliated with Grandeur Peak Global Advisors or its affiliates.
©2025 Grandeur Peak Global Advisors, LLC.