Share Class
Capitalization
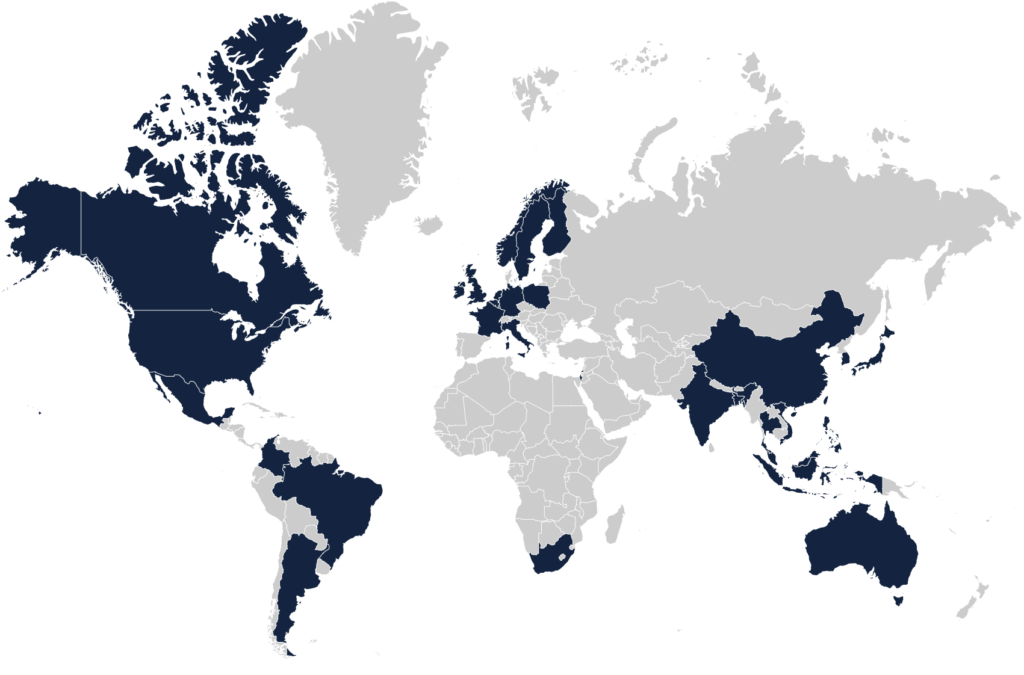
Geography
Inception
Brad Barth
Research Analyst & Portfolio Manager
Deputy Chief Investment Officer
Randy Pearce, CFA®
Research Analyst & Portfolio Manager
Chief Investment Officer
Phil Naylor
Research Analyst & Portfolio Manager
Primary | MSCI ACWI IMI Indexⓘ
MSCI ACWI IMI Index
The MSCI ACWI IMI Index is designed to measure the equity market performance of large, mid, and small-cap companies across developed and emerging markets globally.
|
Secondary | MSCI ACWI Mid Cap Indexⓘ
MSCI ACWI Mid Cap Index
The MSCI ACWI Mid Cap Index is designed to measure the equity market performance of mid-cap companies across developed and emerging markets globally.
|
Teriary | MSCI ACWI Small Cap Indexⓘ
MSCI ACWI Small Cap Index
The MSCI ACWI Small Cap Index is designed to measure the equity market performance of small-cap companies across developed and emerging markets globally.
|
Fund inception of 09/01/2015
The performance data quoted represents past performance. Current performance may be lower or higher than the performance data quoted above. Past performance is no guarantee of future results. The investment return and principal value of an investment will fluctuate so that investor’s shares, when redeemed, may be worth more or less than their original cost. For performance information current to the most recent month-end, please call 1.855.377.PEAK (7325).
Returns for periods greater than one year are annualized. The Advisor may absorb certain Fund Expenses, without which total return would have been lower. Net expense ratios reflect the expense waiver, if any, contractually agreed to through September 1, 2025. A 2% redemption fee will be deducted on fund shares held 60 days or less. Performance data does not reflect this redemption fee or taxes.
Year end as of 12/31/2023
wdt_ID | 2023 | 2022 | 2021 | 2020 | 2019 | 2018 | 2017 | 2016 | |
---|---|---|---|---|---|---|---|---|---|
1 | Grandeur Peak Global Stalwarts - Institutional | 17.19% | -39.39% | 21.22% | 41.13% | 32.34% | -14.90% | 31.58% | 8.29% |
2 | MSCI ACWI IMI Index | 22.18% | -18.00% | 18.71% | 16.81% | 27.04% | -9.61% | 24.58% | 8.96% |
3 | MSCI ACWI Mid Cap Index | 15.93% | -18.37% | 16.84% | 15.65% | 26.60% | -12.88% | 24.98% | 7.70% |
4 | MSCI ACWI Small Cap Index | 17.41% | -18.27% | 16.54% | 16.83% | 25.23% | -14.03% | 24.32% | 12.10% |
The performance data quoted represents past performance. Current performance may be lower or higher than the performance data quoted above. Past performance is no guarantee of future results. The investment return and principal value of an investment will fluctuate so that investor’s shares, when redeemed, may be worth more or less than their original cost. For performance information current to the most recent month-end, please call 1.855.377.PEAK (7325).
Returns for periods greater than one year are annualized. The Advisor may absorb certain Fund Expenses, without which total return would have been lower. Net expense ratios reflect the expense waiver, if any, contractually agreed to through September 1, 2025. A 2% redemption fee will be deducted on fund shares held 60 days or less. Performance data does not reflect this redemption fee or taxes.
As of 9/30/24, updated quarterly, subject to change.
Estimated 3-Year EPS Growthⓘ
Estimated 3-Year EPS Growth
Estimated weighted average annual increase in Earnings Per Share (EPS) of the fund's holdings over the next 3 years. These returns are not guaranteed. Actual EPS growth may be higher or lower.
| 17.7% |
Trailing P/Eⓘ
Trailing P/E
The trailing 12-month Price/Earnings (P/E) of the portfolio, calculated as a weighted harmonic average.
| 31.6 |
Return on Assetsⓘ
Return on Assets
Return on Assets (ROA) is a measure of how efficiently a company uses its assets to generate a profit, and is calculated by dividing company’s net income by total assets.
| 9.3% |
Operating Marginⓘ
Operating Margin
Operating Margin is a measurement of what proportion of a company's revenue is left over after paying for variable costs of production such as wages, raw materials, etc. It is calculated by dividing Operating Income by Net Sales.
| 16.3% |
Debt/Equity ⓘ
Debt/Equity
Debt/Equity is a measure of a company's financial leverage. It is calculated by dividing its total liabilities by stockholders' equity.
| 74% |
Weighted Average Market Cap ($millions)ⓘ
Weighted Average Market Cap
The average market capitalization of companies held by the fund, weighted in proportion to their percentage of net assets in the fund.
| $10,373 |
Median Market Cap ($millions)ⓘ
Median Market Cap
The median market cap is the midpoint of market capitalization of companies held by the fund.
| $5,691 |
Number of Holdings | 150 |
Portfolio Turnoverⓘ
Portfolio Turnover
A measure of annual trading activity in the fund's portfolio, expressed as a percent.
| 55% |
Access All Fund Holdings
Download XLSAccess All Fund Holdings
Download XLSAs of 07/31/2024, updated quarterly, subject to change
Company Name | Country | Sector | % of Net Assets | |
---|---|---|---|---|
1 | BayCurrent Consulting, Inc. | Japan | Technology | 3.6% |
2 | Littelfuse, Inc. | United States | Industrials | 3.3% |
3 | B & M European Value Retail SA | Britain | Consumer Staples | 3.2% |
4 | Silergy Corp | China | Technology | 2.5% |
5 | Globant S.A. | Argentina | Technology | 1.7% |
6 | JTC plc | Britain | Financials | 1.6% |
7 | Elastic N.V. | United States | Technology | 1.5% |
8 | Melexis NV | Belgium | Technology | 1.4% |
9 | Virbac SA | France | Health Care | 1.3% |
10 | Pjt Partners, Inc. | United States | Financials | 1.2% |
Total Top 10 Holdings | 21.3% |
Holdings are released based on a 60-day lag from the most recent quarter end according to the Grandeur Peak Holdings Release Policy. Holdings are subject to change and do not constitute a recommendation or solicitation to buy or sell a particular security. Current and future holdings are subject to risk. Total amount subject to rounding.
% of Total Equities | |
---|---|
North America | 44.1% |
Europe | 28.5% |
Asia ex Japan | 14.9% |
Japan | 8.9% |
Latin America | 2.6% |
Australia/New Zealand | 1.1% |
Africa/Middle East | 0.9% |
Total | 100.0% |
% of Total Equities | ||
---|---|---|
1 | United States | 39.2% |
2 | Britain | 9.2% |
3 | Japan | 8.9% |
4 | China | 4.3% |
5 | Sweden | 3.9% |
Total Top 5 Countries | 65.4% |
Cash & Equivalents | 1.1% |
© 2011-2024 Grandeur Peak Global Advisors, LLC. All rights reserved.
IMPORTANT RISKS
Any investing, including in mutual funds, involves risks and loss of principal is possible. Investing in international or global funds, small- or micro-cap funds, or related strategies will be more volatile and the risk of principal loss could be greater than investing in domestic, large-cap or more diversified funds or strategies. Investing in foreign securities also entails special risks, such as currency fluctuations and political uncertainties, which are described in more detail in the prospectus. Investments in emerging markets are subject to greater risk than investments in the United States or in foreign countries with more established economies and securities markets.
Investment advisory services for the Grandeur Peak Funds and related separately managed accounts are provided by Grandeur Peak Global Advisors, LLC, a federally registered investment adviser.
Grandeur Peak Funds are distributed by Northern Lights Distributors, LLC, Member FINRA/SIPC. Northern Lights Distributors, LLC. is not affiliated with Grandeur Peak Global Advisors, LLC.